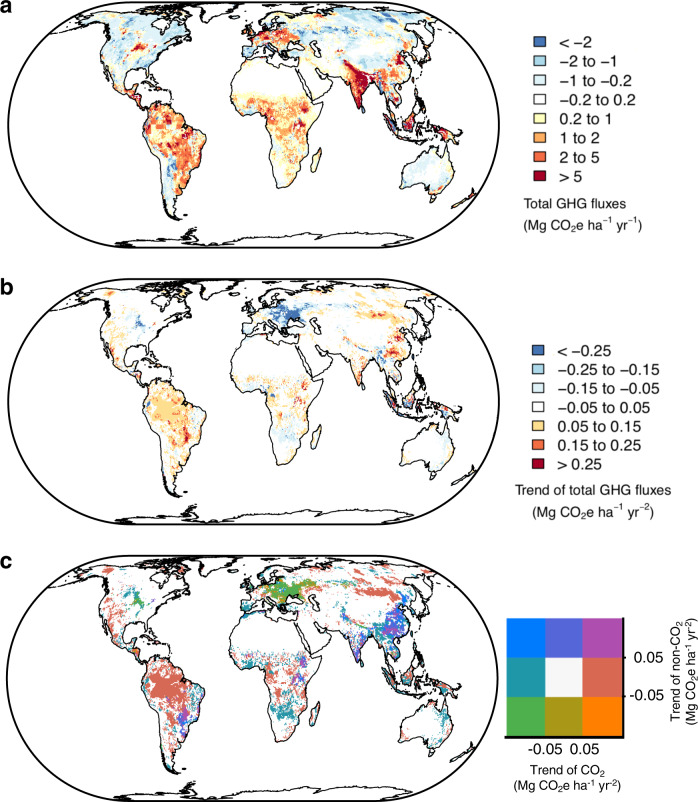
Fig. 3. Global distribution of grassland greenhouse gas (GHG) balance during the period 1981–2010.
a Mean value, b its trend, and c the trends of CO2 fluxes versus non-CO2 fluxes. Negative values in a, the total GHG fluxes, indicate GHG sinks and positive values indicate GHG sources. Negative values in b, the trend of total GHG fluxes, indicate enhanced GHG sinks or decreased GHG emissions, while positive values indicate increased GHG emissions or attenuated GHG sinks.

