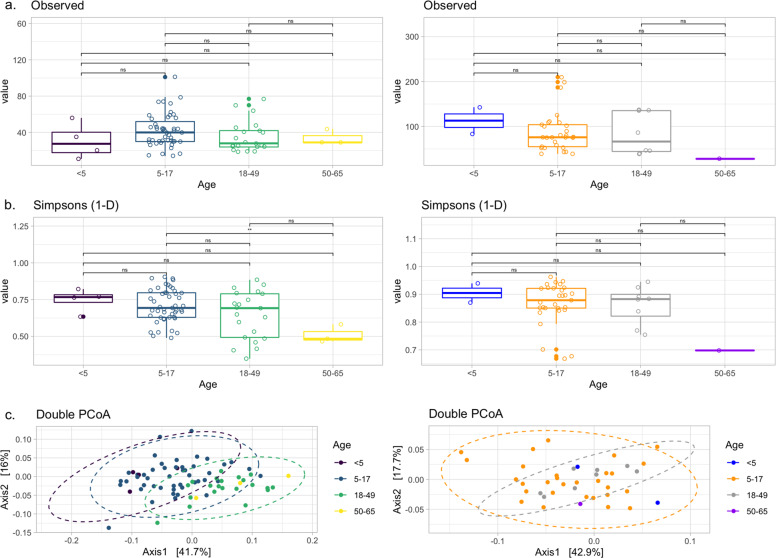
Fig. 4. Alpha and beta diversity of nasal (left column) and oral (right column) samples.
Observed richness and Simpsons 1-D (a measure of diversity) are shown in panels a and b respectively. Only a significant difference (**) was observed for nasal samples for those aged 5–17 when compared against 50–65 (p = 0.0023). Beta diversity is shown using Double Principle Co-ordinates Analysis (DPCoA) (panel c). Here, clusters are observed for nasal samples (left) with grouping based on age group. No clusters were observed for oral samples (right).

