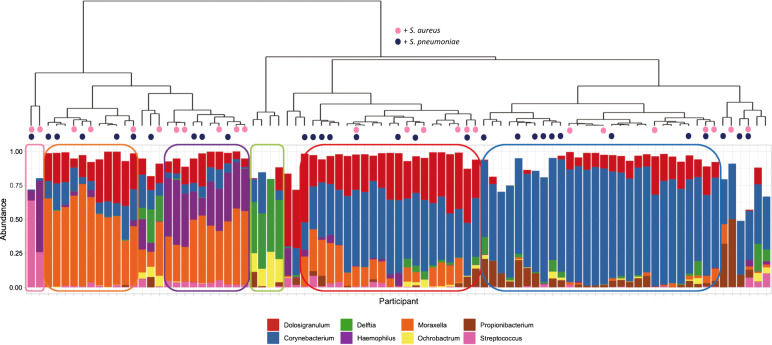
Fig. 5. Hierarchical clustering of nasal samples with Bray–Curtis dissimilarity using genus-level relative abundances.
The dendrogram (top) shows clustering of samples with the below bar chart showing the relative abundance of the eight most commonly observed Genera. Six clear clusters were observed including a Corynebacterium dominant profile (n = 28; 35.4%), a Corynebacterium/Dolosigranulum profile (n = 16; 20.3%), a Moraxella profile (n = 10; 12.7%) a Moraxella/Haemophilus profile (n = 10; 12.7%), a Delftia/Orchobactum profile (n = 4; 5.1%) and a final group of two samples characterised by high Streptococcus, in one case with Haemophilus. Culture results for S. aureus (dark blue) and S. pneumoniae (pink) are shown as coloured circles at the tips of the dendrogram. There is no clear distribution of individuals who were culture positive for either bacterium.

