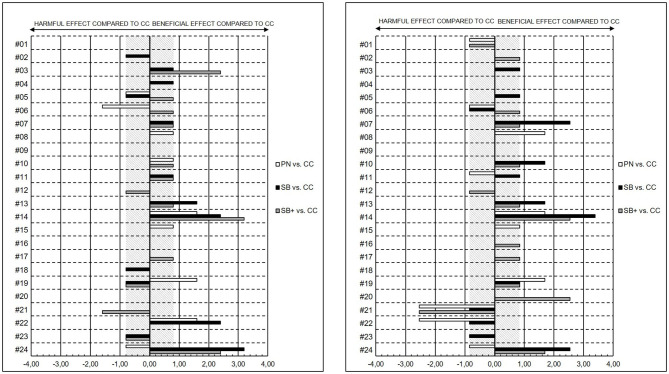
Figure 6.
Individual standardized differences in the pre-MR to post-MR changes presented as effect sizes (ES) between powernap (PN), systematic breathing (SB), systematic breathing plus mental imagery (SB+) and control condition in the OR (left) and in the PPC (right). The gray stripped areas respresent the smallest worthwhile change (SWC) in the OR as well as in the PPC.

