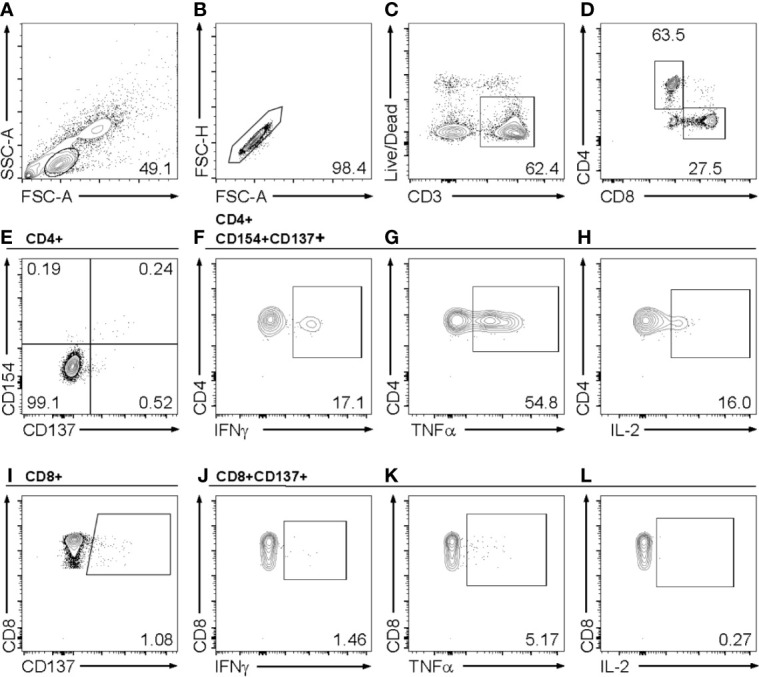
Figure 1.

Gating strategy for flow cytometry analysis of activated CD4+ and CD8+ T cells and their cytokine expression profile. Example of a gating strategy in a post coronavirus disease 2019 (COVID-19) healthy control (HC) in response to stimulation with the SARS-CoV-2 C-terminal spike peptide pool. Shown are (A) lymphocytes, (B) single cells, (C) living CD3+ T cells, (D) CD4+ and CD8+ T cells, (E) activated CD154+CD137+CD4+ T cells, (F–H) production of IFNγ (F), TNFα (G) and IL-2 (H) in CD154+CD137+ activated CD4+ T cells (I) and in CD137+CD8+ activated T cells (H–J) production of IFNγ (J), TNFα (K) and IL-2 (L) in activated CD8+ T cells. Single, double (dp) or triple (tp) cytokine producing activated T cell subsets were analyzed using Boolean combination gates.
