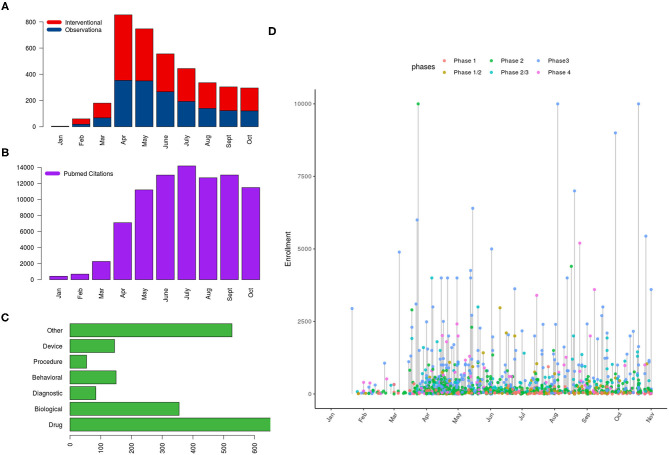
Figure 1.
Distribution of clinical trials registered on ClinicalTrials.gov and PubMed citations referring to COVID-19 as of October 31, 2020; the panels show (A) the distribution of studies according to type and month of posting, (B) number of PubMed citations per month, (C) the type of intervention in interventional trials, and (D) a lollipop graph showing the anticipated number of subjects to be enrolled on interventional trials with the horizontal axis indicating the date of first posting of studies (year 2020) and the y axis indicating the required number of subjects to be enrolled (capped at 10,000); color of the points indicates the phase of trial.

