FIGURE 6.

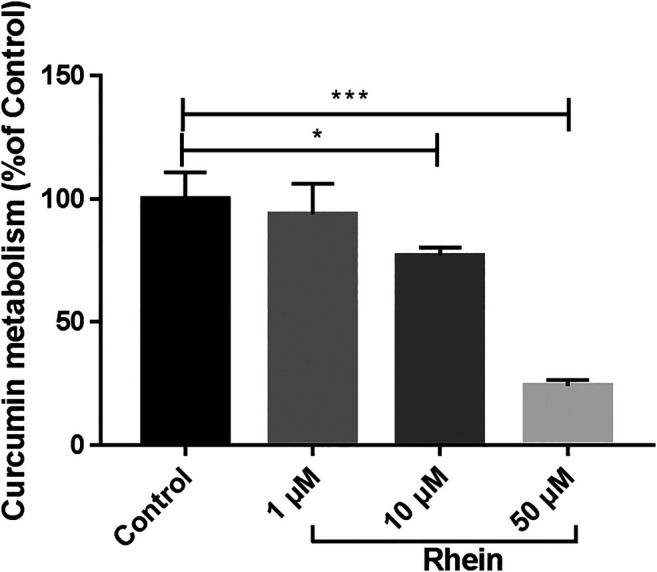
Relatively metabolic amount of curcumin after incubation with different concentrations of rhein. *p < 0.05, ***p < 0.01, compared to control group.

Relatively metabolic amount of curcumin after incubation with different concentrations of rhein. *p < 0.05, ***p < 0.01, compared to control group.