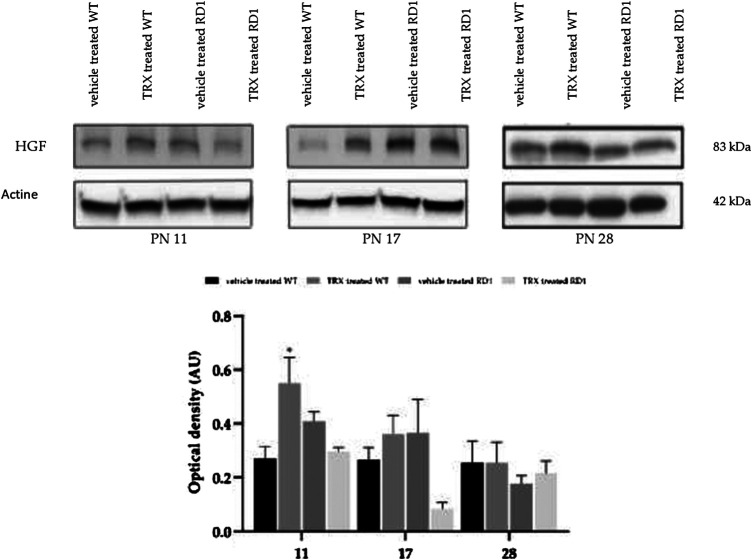
FIGURE 7.
Retinal HGF determination by western blot. (A) Western-blot bands images for control and rd1 mice (n = 3). (B) Histogram represents the bands optical density quantification (HGF/Actin ratio) in each group. The error bars represent the standard error of the mean. (*p < 0.05 vs. all the other groups). N = at least four in each experimental group.

