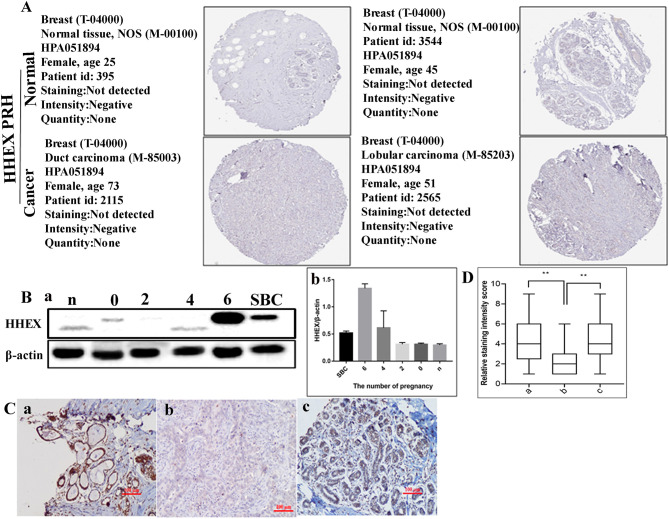
Figure 2.
HHEX expression in human breast cancer (BC) tissues. (A) HHEX protein expression in BC tissues determined using HPA. (B) Expression levels of HHEX. (a) Expression levels of HHEX by western blot analysis in TA2 mice with different numbers of pregnancies and SBC. (b) Histogram shows the quantitative results of the HHEX expression in breast tissue TA2 mice with different numbers of pregnancies and SBC. (C) Immunohistochemical (IHC) staining of HHEX expression in human breast tumors (200×). (a–c) HHEX expression in group I–III, respectively. (D) Interquartile spacing diagram showing the quantitative results of the HHEX expression in the three groups. a: precancerous lesions; b: breast cancer; c: benign breast tumors. n, breast tissues of virgin TA2 mice; 0, breast tissues of TA2 mice without pregnancy; 2, breast tissues of TA2 mice with 2 pregnancies; 4, breast tissues of TA2 mice with 4 pregnancies; 6, breast tissues of TA2 mice with 6 pregnancies;. SBC, spontaneous breast cancer. Statistically significant differences are indicated: **P < 0.001.

