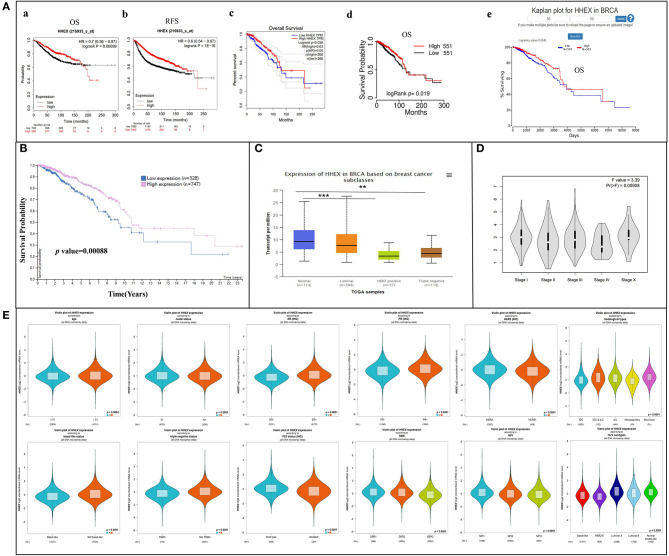
Figure 3.
Prognostic value of HHEX in breast cancer (BC) and relationship between HHEX and clinicopathological parameters of BC patients. (A) Kaplan–Meier plotter, GEPIA, TCGAportal, and OncoLnc reveal the prognostic value of HHEX in BC. (a) Kaplan–Meier plotter reveals the overall survival curves based on the mRNA level of HHEX in BC patients. (b) Kaplan–Meier plotter reveals relapse-free survival curves based on the mRNA level of HHEX in BC patients. (c) Overall survival curves of HHEX in BC patients determined using GEPIA. (d) Overall survival curves of HHEX in BC patients determined using TCGAportal. (e) Overall survival curves of HHEX in BC patients determined using OncoLnc. (B) Survival curves based on protein level of HHEX in BC patients determined using HPA. (C) Relationship between mRNA levels of HHEX with subclasses of BC determined using UALCAN. (D) Correlation between HHEX and the pathological stage of BC patients determined using GEPIA. (E) Relationship between mRNA levels of HHEX and clinicopathological parameters of BC patients determined using bc-GenExMiner. **P < 0.05, ***P < 0.001.

