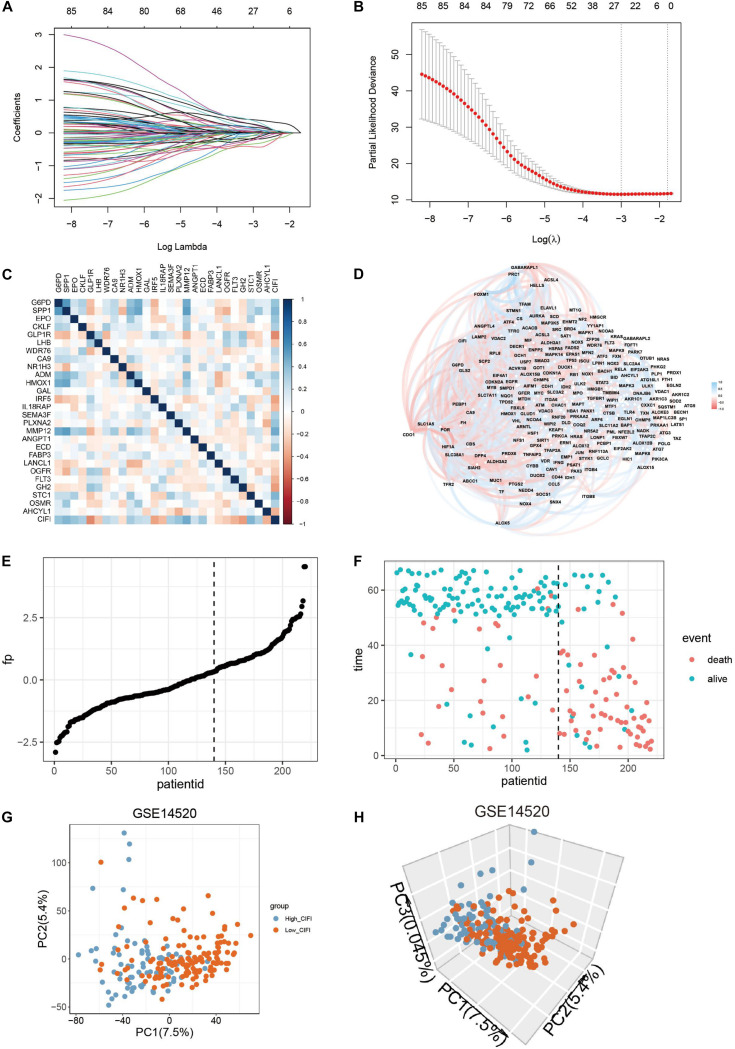
FIGURE 2.
Construction of a predictive model and the CIFI of HCC. (A,B) The LASSO Cox regression model was constructed from the 85 prognostic genes, and the tuning parameter (λ) was calculated based on the partial likelihood deviance with 10-fold cross-validation. An optimal log λ value is indicated by the vertical black line in the plot. (C,D) Correlation networks (C) between the CIFI value and the 27 signature genes or (D) between the CIFI value and the ferroptosis-related genes in the GSE14520 dataset. (E,F) The distribution and optimal cutoff value of (E) the risk scores and (F) the OS status and OS in the GSE14520 dataset. (G,H) The (G) 2D and (H) 3D plots of the PCA of the GSE14520 dataset based on the expression profiles of the 27 signature genes in different risk groups.

