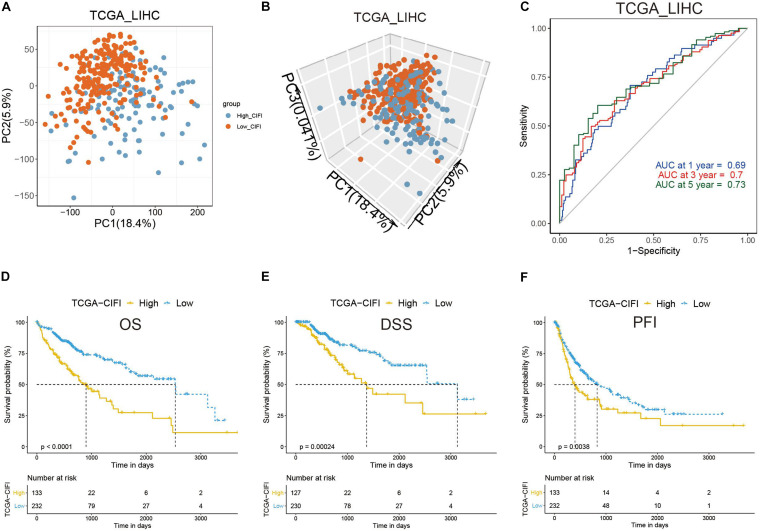
FIGURE 4.
Validation of the CIFI in the TCGA cohort. (A) 2D and (B) 3D plots of the PCA of the TCGA dataset. (C) Time-dependent ROC analysis of the CIFI regarding the OS and survival status in the TCGA cohort. (D–F) Kaplan–Meier plots of the (D) OS, (E) DSS, and (F) PFI in the high-CIFI and low-CIFI subgroups of the TCGA cohort.

