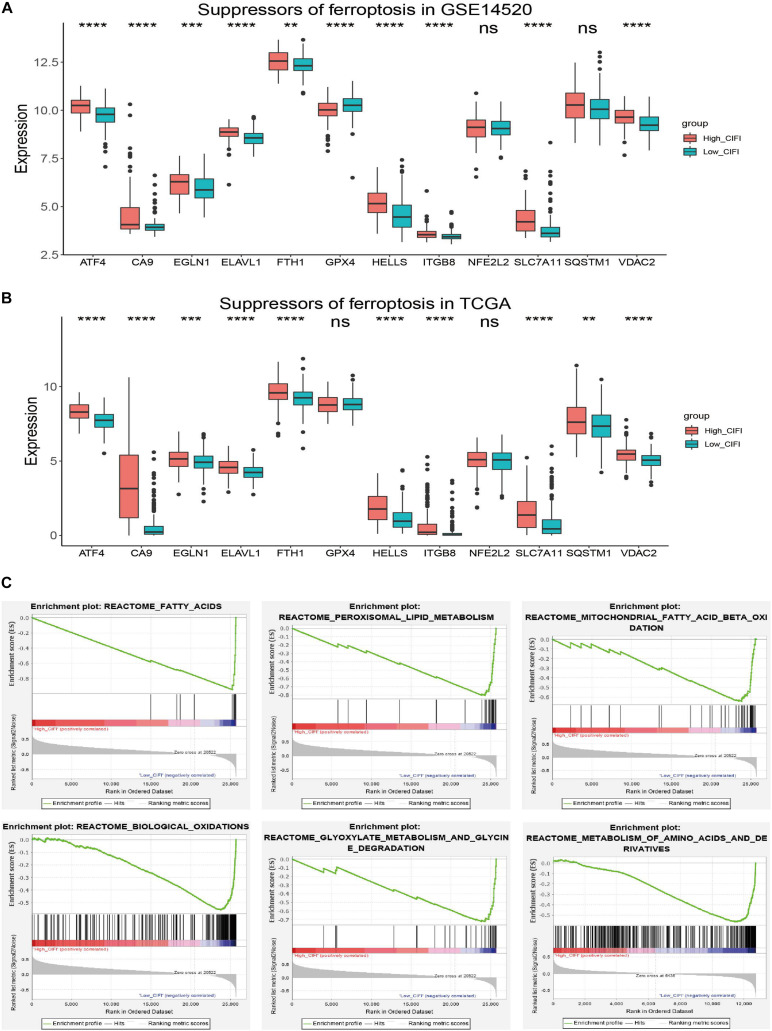
FIGURE 5.
Ferroptosis profiles in the CIFI-stratified groups. (A,B) Comparison of the expressions of the suppressors of ferroptosis between the high- and low-CIFI subgroups of the (A) GSE14520 and (B) TCGA cohorts. (C) GSEA of the CIFI-stratified groups in the GSE14520 and TCGA cohorts. **p < 0.01; ***p < 0.001; ****p < 0.0001.

