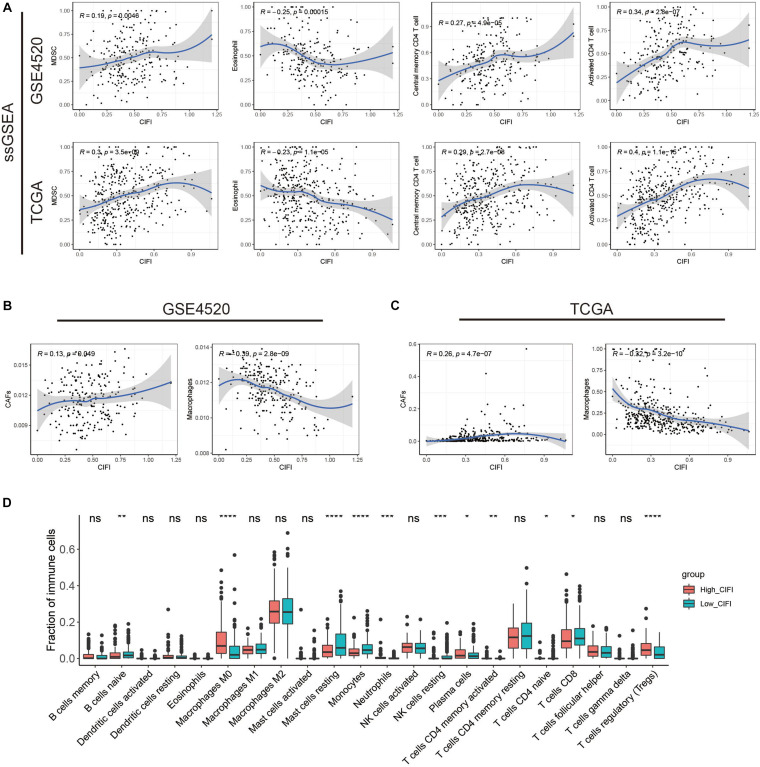
FIGURE 6.
Immune profiles in the CIFI-stratified groups. (A) ssGSEA and correlation analysis of the CIFI value and the immune enrichment scores of immune categories in the GSE14520 and TCGA cohorts. (B,C) ECIP and correlation analysis of the CIFI value and the fraction of immune cells in the GSE14520 and TCGA cohorts. (D) Comparison between the fractions of immune cells in the high- and low-CIFI subgroups of the TCGA cohort via the CIBERSORT method. *p < 0.05; **p < 0.01; ***p < 0.001; ****p < 0.0001.

