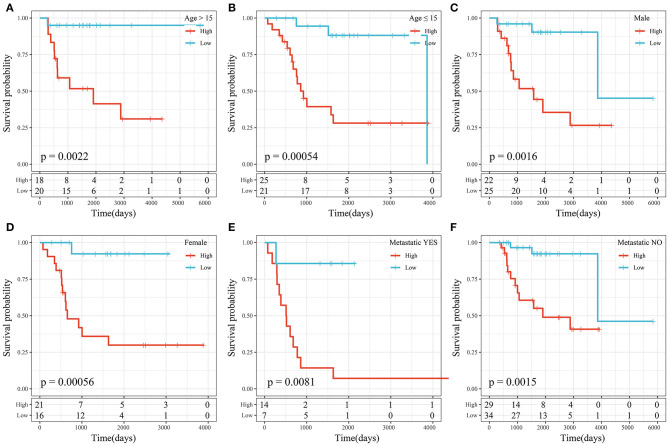
Figure 10.
(A) KM curve of high- and low-risk samples with age >15 years. (B) KM curve of high- and low-risk samples with age ≤ 15 years. (C) KM curve of high- and low-risk samples of male sex. (D) KM curve of high- and low-risk samples of female sex. (E) KM curve of high- and low-risk samples with metastasis. (F) KM curve of high- and low-risk samples without metastasis.

