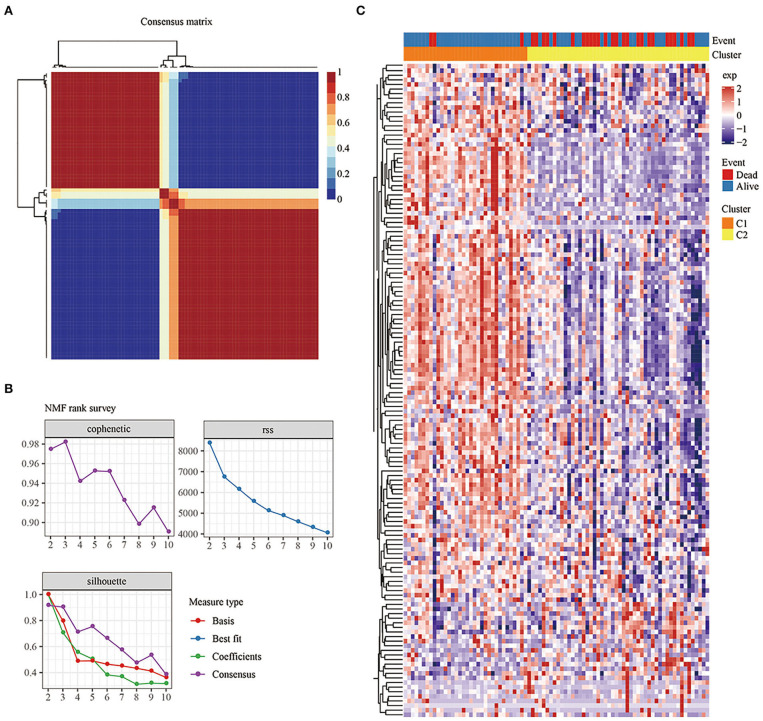
Figure 2.
(A): Consensus map of NMF clustering. (B) Cophenetic, rss, and dispersion distributions with ranks from 2 to 10. Cophenetic correlation is obtained based on the concordance matrix proposed by Brunet et al. and it is used to reflect the stability of the clusters obtained from NMF. The value of cophenetic correlation is between 0 and 1, and the larger the value, the more stable the clusters. The rss refers to the residual sum of squares, which is used to reflect the clustering performance of the model. The smaller the value, the better the clustering performance of the model. Theoretically, this value is the smallest when each sample is clustered into 1 class, but such results are not available in practice, so it needs to be used in combination with other indicators. (C) Heat map of the expression of the prognosis-related genes in the different subtypes.

