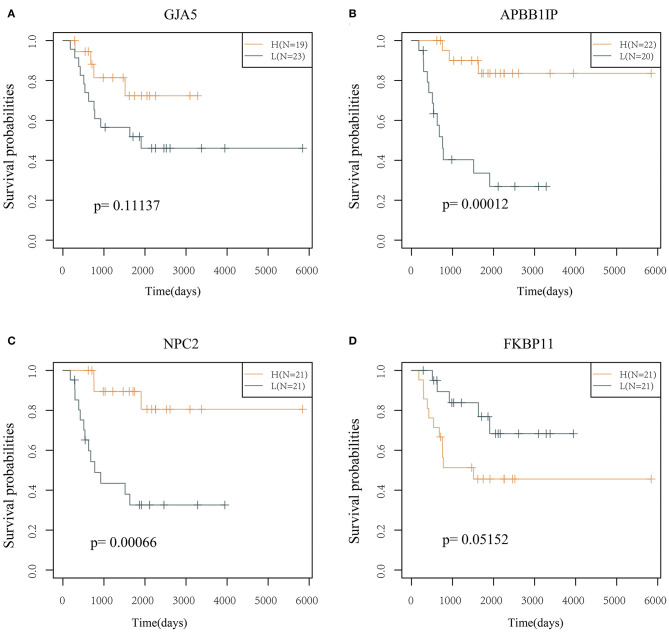
Figure 5.
KM curve of the 4 genes (in the TARGET training cohort). (A) The survival curve of GJA5 gene. (B) The survival curve of APBB1IP gene. (C) The survival curve of NPC2 gene. (D) The survival curve of FKBP11 gene. The abscissa represents survival time, and the ordinate represents survival probability.

