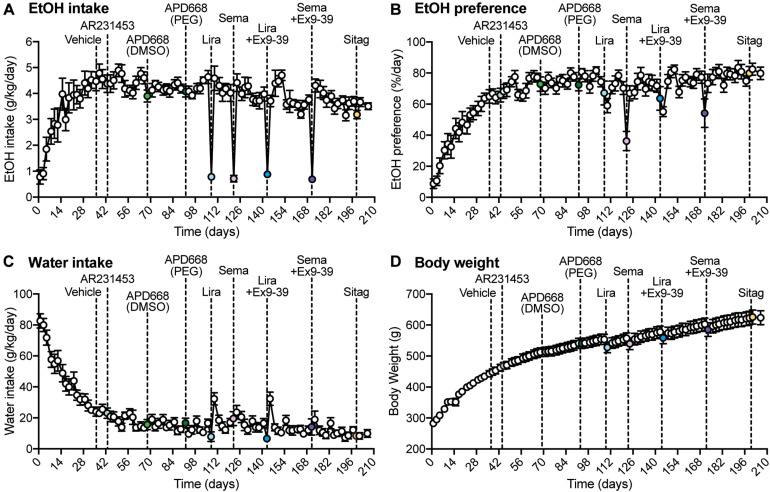
FIGURE 1.
Overall measurements of EtOH intake, EtOH preference, water intake, and body weight during the experiment. (A–D) Dashed lines represent the time of injection of each drug. Vehicle was injected at day 36. AR2314553 (light green circle) was injected at day 43. APD668 (DMSO) (green circle) was injected at day 68. APD668 (PEG) (dark green circle) was injected at day 92. Liraglutide (Lira, light blue circle) was injected at day 108. Semaglutide (Sema, lavender circle) was injected at day 122. Liraglutide + Ex9-39 (Lira + Ex9-39, blue circle) was injected at day 143. Semaglutide + Ex9-39 (Sema + Ex9-39, purple circle) was injected at day 171. Sitagliptin (Sitag, yellow circle) was injected at day 199. (A) Time course of the average EtOH intake (g/kg/day) (n = 12 rats). EtOH intake was measured on Mondays, Wednesdays, and Fridays from day 1 to 206. From day 1 to 29, rats progressively drank higher amounts of EtOH 10% (v/w) until reaching a plateau. (B) Time course of the average EtOH preference (%/day) (n = 12 rats). EtOH preference was calculated as the ratio of EtOH-containing solution over the total fluid consumed in a 24-h drinking session (see section “Materials and Methods”). EtOH preference progressively increased until reaching a plateau. (C) Time course of the average water intake (g/kg/day) (n = 12 rats). Water intake progressively decreased until reaching a plateau. (D) Time course of the average body weight (g) (n = 12 rats). The average body weight was 280 ± 2.96 g at day 1, and progressively increased throughout the experiment to reach an average of 623 ± 22.56 g at day 206.

