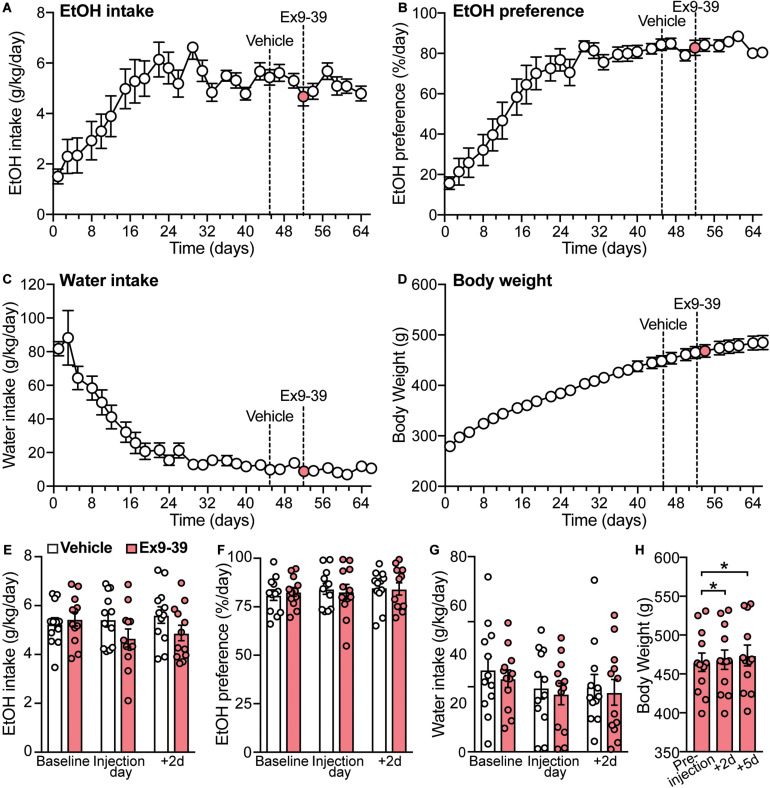
FIGURE 6.
Overall measurements of EtOH intake, EtOH preference, water intake, and body weight for the second cohort of rats (n = 12). (A–D) Dashed lines represent the time of injection of vehicle (day 45) and Ex9-39 (day 52). (E–G) Effects of Ex9-39, compared to vehicle, on EtOH intake, preference, water intake; bars and circles represent the mean and individual data points, respectively. Baseline represents the average of 3 presentations prior to vehicle/drug injection. No significant treatment × time-point interaction effects on EtOH intake, EtOH preference, or water intake were found (note: the effect of the interaction term on EtOH intake was statistically significant, but due to low power, these results were concluded to be potentially false positive). (H) Effects of Ex9-39 on body weight. Significant changes in body weight were observed; body weight at + 2d and + 5d was higher than the body weight measured on injection day (pre-injection). *p < 0.05.

