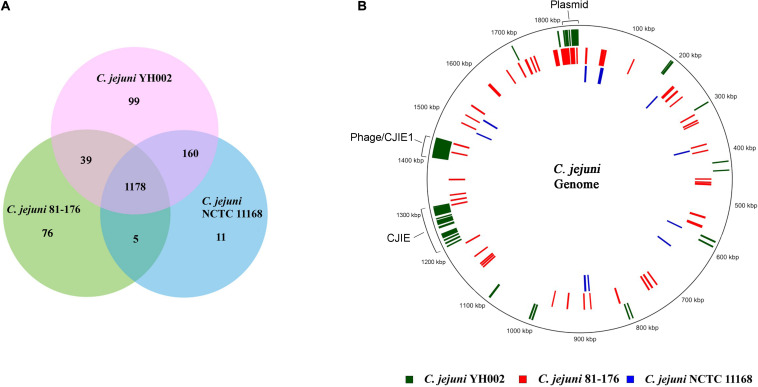
FIGURE 3.
Comparative analysis of the methylome of the C. jejuni strains YH002, 81–176 and NCTC 11168. The Venn diagram (A) depicts the overlapping and unique CDSs methylated among C. jejuni YH002, C. jejuni 81–176, and C. jejuni NCTC 11,168, while the schematic (B) shows the relative locations of the uniquely methylated CDSs in the three C. jejuni genomes. The locations of the plasmid-borne genes are also shown.

