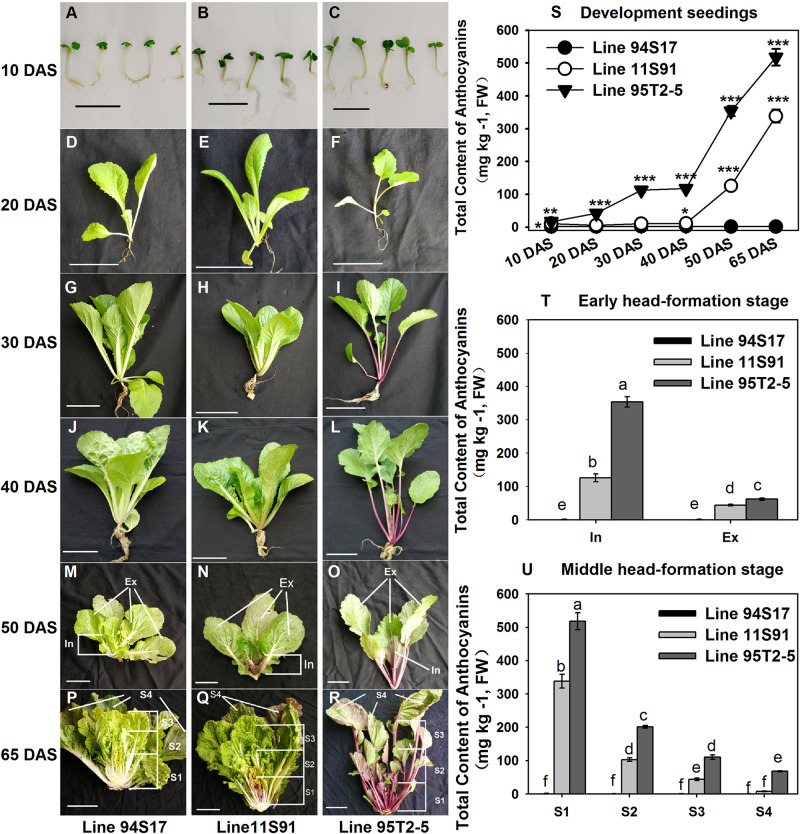
FIGURE 1.
Phenotypes and total anthocyanin content of different development tissues of three Chinese cabbages. (A,R) Images in each vertical sample column (left to right) were collected from 94S17, 11S91, and 95T2-5. (A–C) 10 DAS (Day after sowing) seedlings; (D–F) 20 DAS seedlings; (G–I) 30 DAS seedlings; (J–L) 40 DAS seedlings. (M–O) 50 DAS plants at the early head-formation stage; the head of 11S91 was divided into two parts: In, the interior heading leaves with deep purple color; Ex, the external functional leaves. (P–R) 65 DAS plants at the middle head-formation stage; the head of 11S91 was divided into four parts: S1, interior heading leaves with a deep-purple color; S2, inner heading leaves with a light-purple color; S3, exterior heading leaves; S4, outer functional leaves. The leaf size and positions of 94S17 and 95T2-5 samples at both stages were collected in the same as 11S91. (S) Total anthocyanin content of the development samples, for which the ‘*’, ‘**’, and ‘***’ above each symbol indicate significant, highly significant, and extremely significant differences at p < 0.05, p < 0.01, and p < 0.001, respectively. (T,U) Total anthocyanin content of different heading samples, for which different letters above each column are significantly different at p < 0.05 according to Duncan’s test. The scale bar is 2 cm in (A–C) and 10 cm in (D–R). The values shown are means ± SDs (n = 3).

