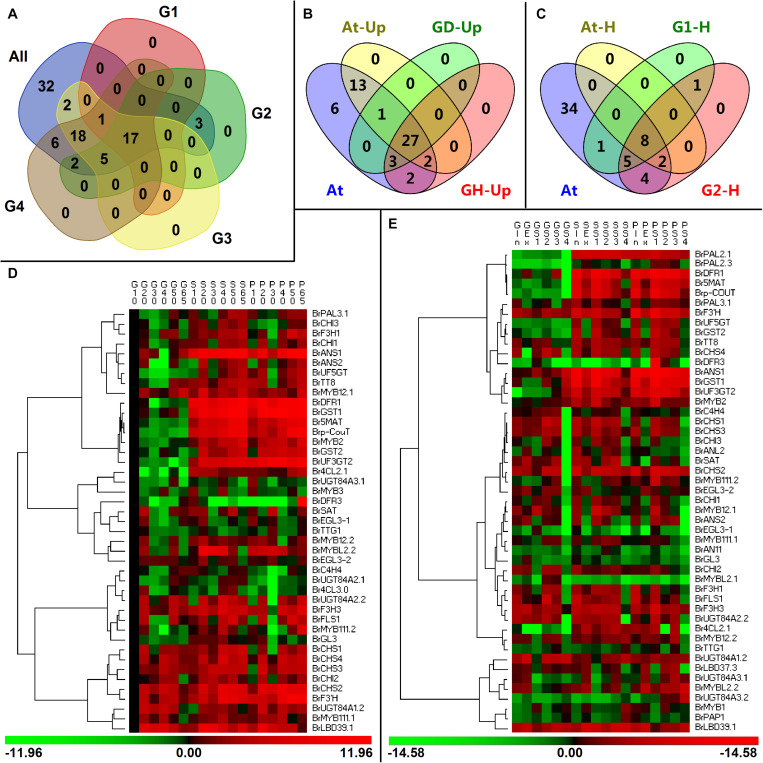
FIGURE 10.
Comparisons of differentially expressed anthocyanin biosynthesis genes (ABGs) in different developing periods of Chinese cabbage and Arabidopsis. (A) Classification of ABGs in Chinese cabbage. All: the tested 86 ABGs of Brassica rapa; G1 and G2 are the classified ABGs which showed significant correlations with total anthocyanin content during plant development and head development, respectively; G3 and G4 show the upregulated ABGs during the plant development and head development, respectively. (B) Classification of upregulated ABGs in Chinese cabbage and Arabidopsis. At, the tested 54 ABGs in Arabidopsis; At-Up, upregulated ABGs in transgenic Arabidopsis; GD-Up, upregulated ABGs during Chinese cabbage development; GH-Up, upregulated ABGs during Chinese cabbage head development. (C) Classification of ABGs which had significant correlations with total anthocyanin content in Chinese cabbage and Arabidopsis; At, the tested 54 ABGs in Arabidopsis; At-H, G1-H, and G2-H are classified ABGs showed significant correlations with total anthocyanin content in transgenic Arabidopsis, development Chinese cabbage plants, and developing Chinese cabbage heads, respectively. (D,E) Hierarchical clustering analyses of expression patterns in upregulated genes during the plant growth (D) and head development (E) of three Chinese cabbages. The expression data were log2-normalized, clustered using PermutMatrix software, and analyzed with the Pearson distance and Ward’s method. Red boxes indicate upregulation, and green boxes indicate downregulation; the color brightness is directly proportional to the expression ratio. The first capital letters ‘G’, ‘P,’ and ‘S’ are different samples of 94S17, 95T2-5, and 11S91, respectively.

