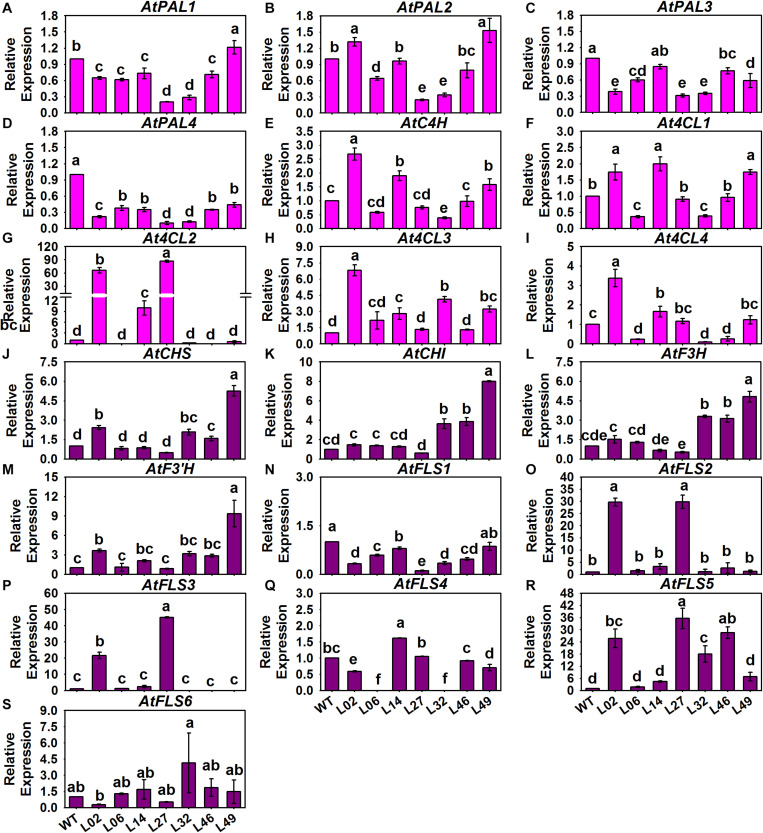
FIGURE 8.
Expression patterns of phenylpropanoid metabolic pathway genes (PMPGs, A–I) and EBGs (J–S) in different BrMYB2 overexpression Arabidopsis lines. The WT line served as the control, and the values shown are means ± SDs (n = 3). The different letters above each column are significantly different at p < 0.05 according to Duncan’s test.

