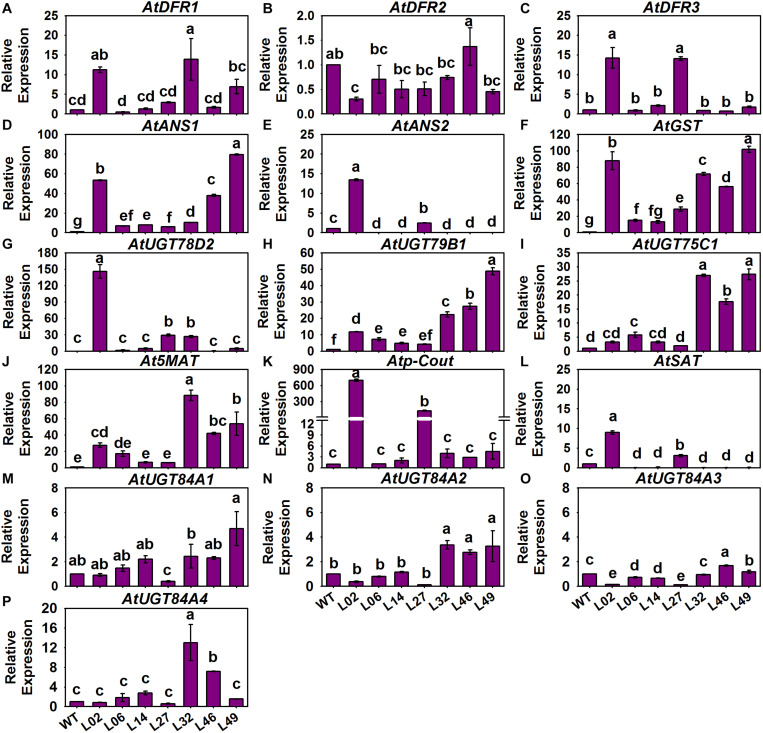
FIGURE 9.
Expression patterns of LBGs and the anthocyanin transport gene in different BrMYB2-overexpressing Arabidopsis lines. (A–E) Expression patterns of LBGs; (F) expression patterns of AtGST; (G–P) expression patterns of LBGs involved in anthocyanins’ modification. The WT line served as the control, and the values shown are means ± SDs (n = 3). The different letters above each column are significantly different at p < 0.05 according to Duncan’s test.

