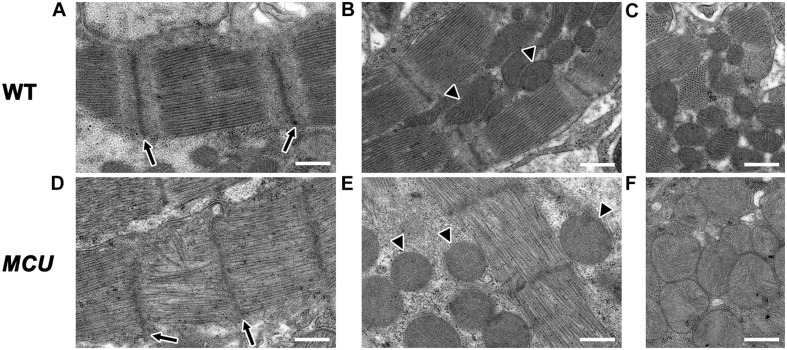
FIGURE 3.
Transmission electron microscopy analysis of MCU mutant ventricles. Representative TEM images of WT (A–C) and MCU (D–F) ventricular cardiomyocytes. (A,D) WT sarcomeres display clear Z-lines (arrows in A) separated by parallel bands of myosin thick filaments. MCU Z-lines are less well defined and patchy (arrows in D) and thick filaments are sometimes disorganized. (B,C) WT myofibrils are closely associated with oval-shaped mitochondria containing tightly packed cristae (arrowheads in B mark examples, C shows more examples). (E,F) MCU myofibrils are also closely associated with mitochondria, but they are less electron-dense and display a round and swollen morphology with more loosely packed cristae [arrowheads in (E) mark examples, (F) shows more examples]. Scale bars indicate 500 nm.

