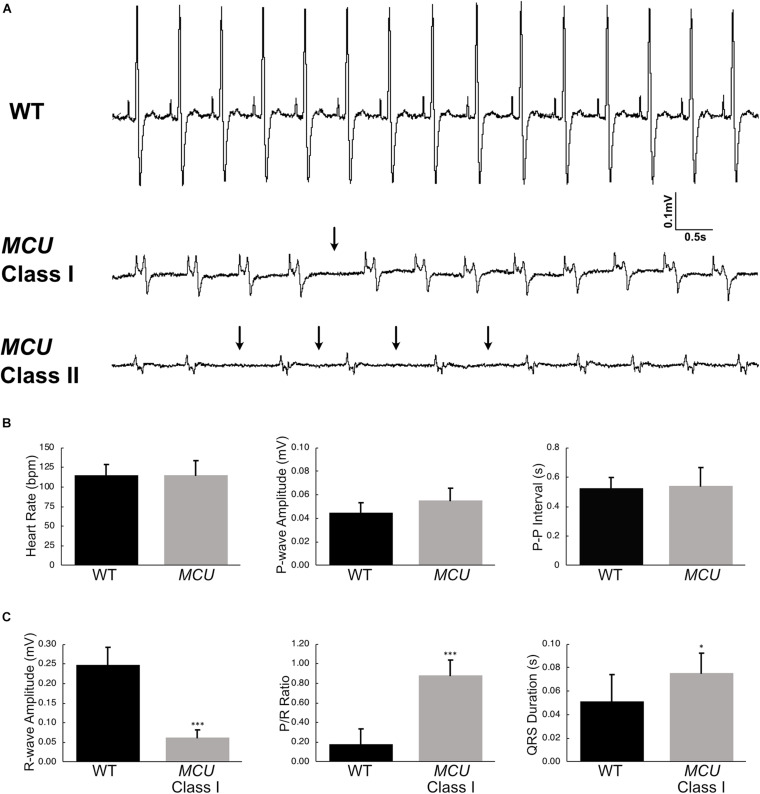
FIGURE 4.
Electrocardiogram analysis of wildtype and MCU mutant fish. (A) ECG tracings of wildtype fish (top), Class I MCU mutant (clearly distinguishable QRS complex, middle) and Class II MCU mutant (highly abnormal QRS complex, bottom) highlight episodes of long beat-to-beat pauses. Arrows point to beat intervals that are greater than mean + 2σ. (B) Analysis and comparison of ECG indices between wildtype and MCU mutants (Class I and II combined). No significant differences were identified in heart rate (115.4 bpm v 115.0 bpm, p > 0.05), P-amplitude (0.045 mV v 0.055 mV, p > 0.05), and P-P interval (0.524 s v 0.539 s, p > 0.05) between wildtype and mutant, respectively. (C) Statistical differences were present in R-wave amplitudes (reduced in MCU Class I mutant, 0.248 mV v 0.062 mV, p < 0.0001), R-wave amplitude-to-P-wave amplitude ratio (increased in MCU Class I mutant, 0.182 v 0.884, p < 0.001), and duration of the QRS complex (prolonged in MCU Class I mutant, 0.0512 s v 0.0721 s, p < 0.05). *p < 0.05; ***p < 0.0001.

