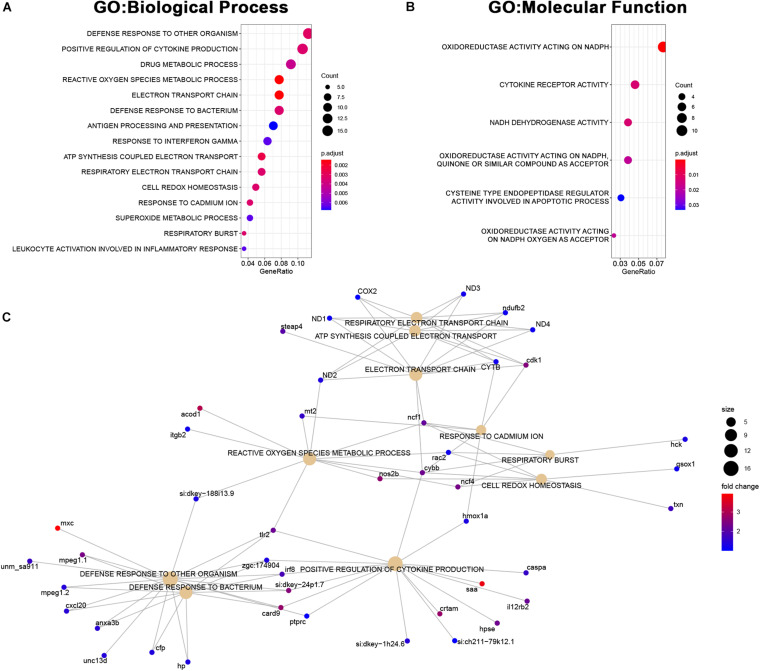
FIGURE 7.
Upregulated genes in MCU hearts reflect altered mitochondrial biology. (A, B) Dot plots of over-represented Biological Process (A) and Molecular Function (B) gene ontology terms in the set of genes that is significantly upregulated in MCU mutant hearts. The dot size indicates the number of genes associated with each term and the dot color indicates the significance of the enrichment (adjusted p-values). (C) Gene concept networks of the top 10 over-represented Biological Process gene ontology terms in the set of genes that is significantly upregulated in MCU mutants. The dot size indicates the number of genes associated with each term and dots representing genes are colored based on their fold-change [log2(fold-change)].

