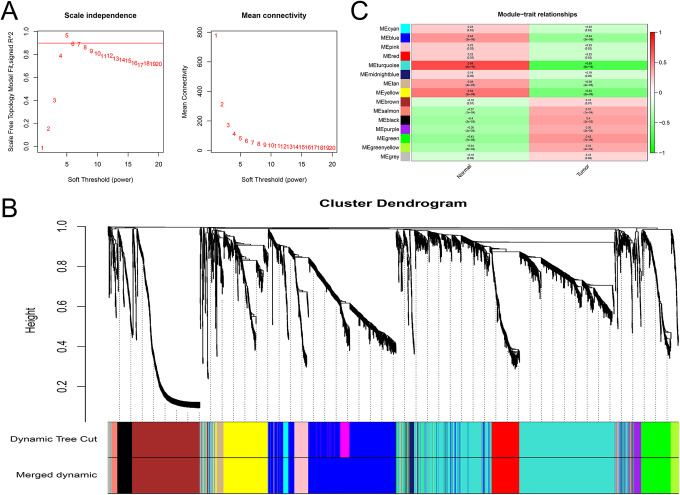
Figure 4.
Co-expression modules identified from the PCa RNA-seq data sets by WGCNA. A, Scale independence and mean network connectivity for soft thresholding powers (β). β =5 was selected to achieve model fit maximization. B, Module–trait relationships between the identified modules and clinical status (normal and tumor): weighted correlations and corresponding p values (in parenthesis). C, Dendrogram produced by average linkage hierarchical clustering of the identified lncRNA-PEG co-expression modules. Genes are linked with each other according to their TOM similarity, resulting in 15 modules. The gray leaves indicate unassigned lncRNAs and PCGs.

