Figure 5.
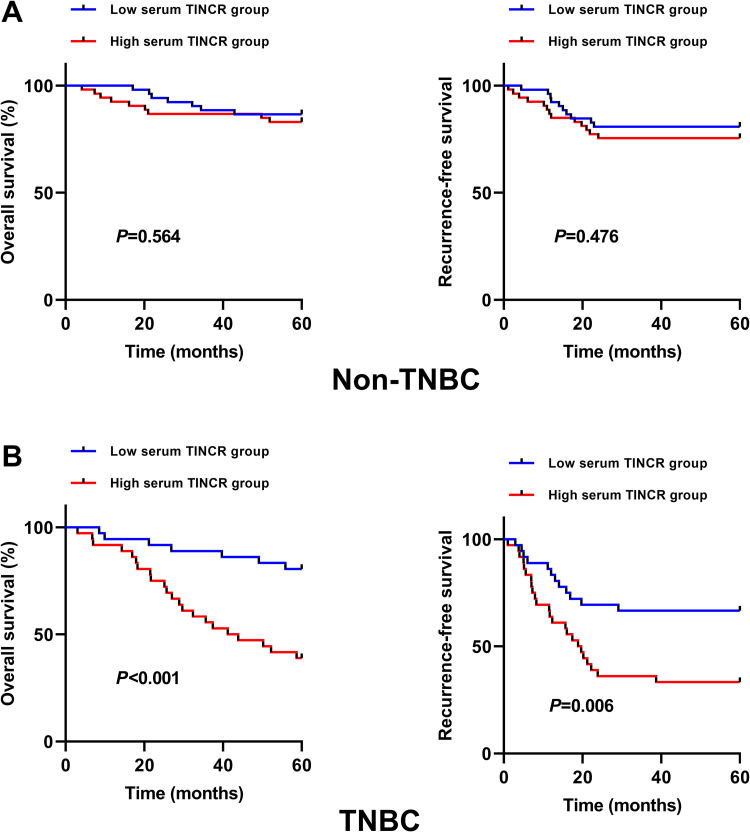
The correlation between serum lncRNA TINCR and OS/RFS in non-TNBC and TNBC. (A) No significant difference for OS (P = 0.564) and RFS (P = 0.476) was found between high and low serum lncRNA TINCR group in non-TNBC (Kaplan-Meier method + log-rank test). (B) The TNBC patients in the high serum lncRNA TINCR group had worse OS (P < 0.001) and RFS (P = 0.006) than those in the low serum lncRNA TINCR group (Kaplan-Meier method + log-rank test).

