
Figure 2.
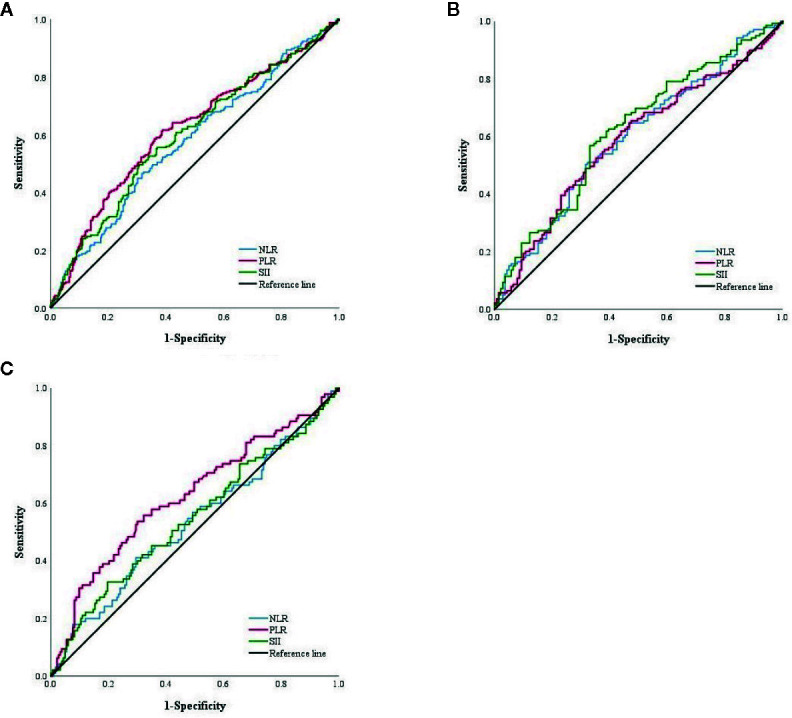
(A) ROC curve of NLR, PLR and SII score among total patients in PSM cohort. (B) ROC curve of NLR, PLR and SII score of patients with FOLFOX. (C) ROC curve of NLR, PLR and SII score of patients with XELOX.
Official websites use .gov
A
.gov website belongs to an official
government organization in the United States.
Secure .gov websites use HTTPS
A lock (
) or https:// means you've safely
connected to the .gov website. Share sensitive
information only on official, secure websites.
(A) ROC curve of NLR, PLR and SII score among total patients in PSM cohort. (B) ROC curve of NLR, PLR and SII score of patients with FOLFOX. (C) ROC curve of NLR, PLR and SII score of patients with XELOX.