
Figure 6.
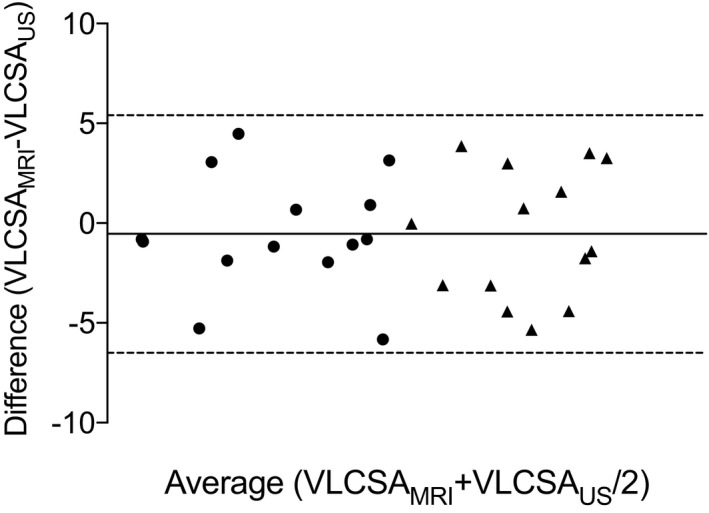
Bland‐Altman plot showing the methodological agreement between the percentage change in VLCSAUS and VLCSAMRI after 10 weeks of resistance training (triangles) and 2 weeks of immobilization (circles). Dotted horizontal lines represent the upper and lower limits of agreement and the solid horizontal line represents the bias of ultrasonography relative to MRI