
Figure 1.
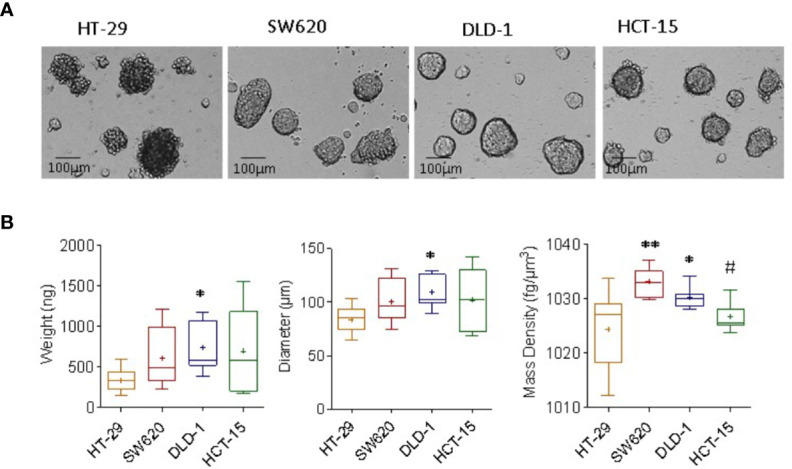
Measurement of mass density, weight and diameter of CRC spheroids. (A) CRC spheroids were generated with HT-29, SW620, DLD-1, and HCT-15 CRC cell lines cultured in ultra-low adherent flat-bottomed microplates and analyzed on day 6 by inverted IX70 microscope (Olympus); images were taken with 20x objective NA 0.40 (200x magnification). Bar in each panel: 100μm. (B) CRC spheroid samples were fixed with 4% PFA and analyzed with the flow-based system. Data are graphically depicted in box-and-whisker plots and the lines, extending from the boxes, indicate variability outside the upper and lower quartiles. Results are expressed as the weight (ng, left graph), diameter (μm, central graph) and mass density (fg/μm3, right graph). *p< 0.05 and **p< 0.001 vs HT-29. #p<0.05 vs DLD-1.