Figure 2.
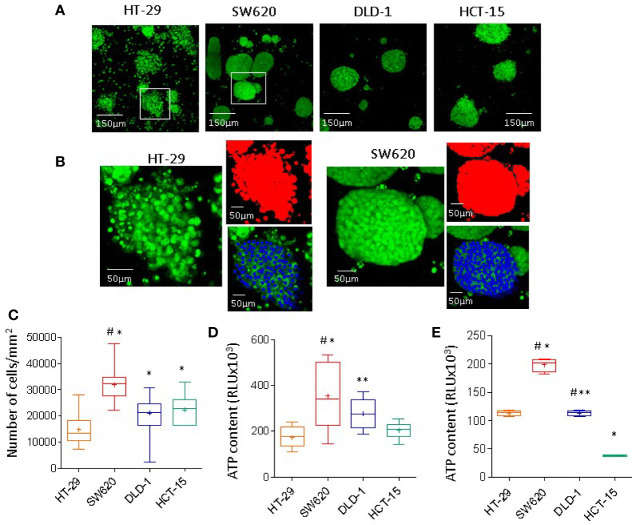
CRC spheroids cell composition and viability. (A) CRC spheroids of HT-29, SW620, DLD-1, or HCT-15 were stained with 1µM Syto16 Green, seeded into a 96w Cell Imaging plate (Eppendorf) and run under the FV500 laser scanning confocal microscope (200x). Images were taken at different Z points set every 10μm (one representative is shown), with FluoView 4.3b software (Olympus GmbH). (B) Image analysis (Image J software) of a spheroid of HT-29 (left) or SW620 (right); enlargement of the white squares in A. Spheroids identified in red pseudocolor, nuclei evidenced in blue pseudocolor. (C) Nuclei were counted with the multipoint and analyze particle tool; results are expressed as cell number/area (mm2) and are the mean±SD of 30 spheroid/cell line counted on 6 Z points/spheroid. ANOVA was performed to evaluate the differences between groups, followed by the Tukey-HSD posthoc test. *p<0.0001 vs HT-29, #p<0.0001 vs DLD-1 and HCT-15. (D) Intracellular ATP content measured using the CellTiter-Glo® Luminescent Cell Viability Kit (Promega). Results are expressed as relative light units (RLU) and are the mean±SD of 16 wells/spheroid cell line. Two-tailed unpaired Student’s t-test was performed to calculate statistical significance. *p<0.0001 vs HT-29, **p<0.001 vs HT-29, #p<0.0001 vs HCT-15. (E) Intracellular ATP content in 20x103 cells for each cell line, rescued from subconfluent (70%) cultures and kept in suspension. Results are expressed as in (D) and are the mean±SD of 4 wells/cell line. Two-tailed unpaired Student’s t-test was performed to calculate statistical significance. *p<0.0001 vs HT-29, **p<0.0001 vs SW620, #p<0.0001 vs HCT-15.

