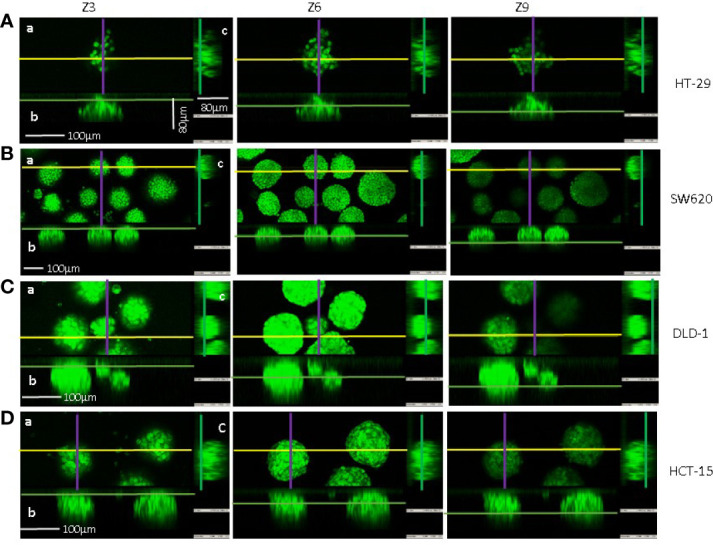
Figure 3.

Confocal microscopy and imaging of CRC spheroid shape. Spheroids of HT-29 (A), SW620 (B), DLD-1 (C), or HCT-15 (D) cell lines were stained with 1µM Syto16 Green Fluorescent Nucleic Acid Stain and run under the FV500 laser scanning confocal microscope. Images were taken with a 20x objective 0.40 NA, at Z points set every 8μm, with FluoView 4.3b software (Olympus). Orthogonal cross-section (indicated as follows: yellow for x axis, purple for y axis and green for z axis) were reconstructed from a set of a z-stack scans (12 sections for 80–96 µm total thickness: z3, z6, z9 are shown for each cell line). For each panel (A–C): a) an example of x-y focal plane of the z reported in the subpanel a; b) side view of the z-stack (orthogonal x-z plane) for subpanel a); c) view in the orthogonal y-z plane for subpanel a. Bar: 100µm are indicated in panels (A–D) of z3.
