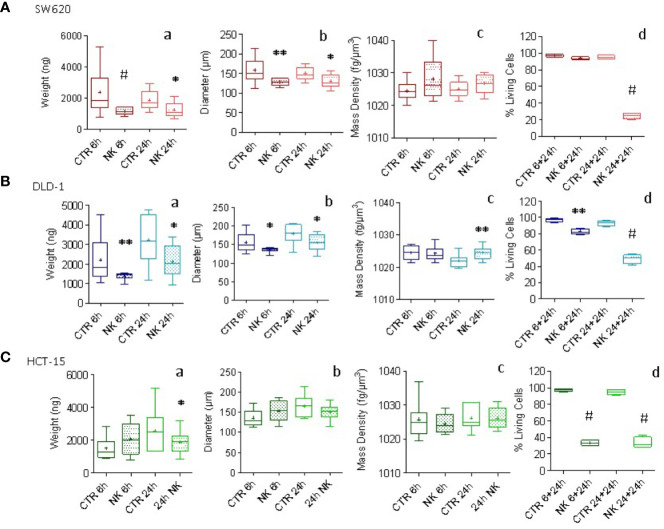
Figure 4.
Evaluation of NK cell killing of CRC spheroids. CRC spheroids generated with SW620 (A), DLD-1 (B) and HCT-15 (C) cell lines were incubated at 37°C with NK cells at the effector:target (E:T) ratio of 1:1 for 6h or 24h. Then, samples were fixed with 4% PFA and analyzed with the flow-based system. Data are graphically depicted in boxes-and-whisker plots and the lines extending from the boxes indicate variability outside the upper and lower quartiles. Results are expressed as weight (ng, a), diameter (μm, b) and mass density (fg/μm3, c). (graph d of A, B, C) Cytolytic activity evaluated in parallel samples at 6h or 24h (+additional 24h to allow living cell attachment) with the Crystal Violet Cell Cytotoxicity Assay Kit (Biovision). The amount of crystal violet proportional to the amount of living cells was measured with the VICTORX5 multilabel plate reader (Perkin Elmer) at the optical density (O.D.) of 595nm. Results are expressed as the percentage of living cells compared to CRC spheroids without NK cells. A-C: *p<0.05; **p<0.001, #p<0.0005.

