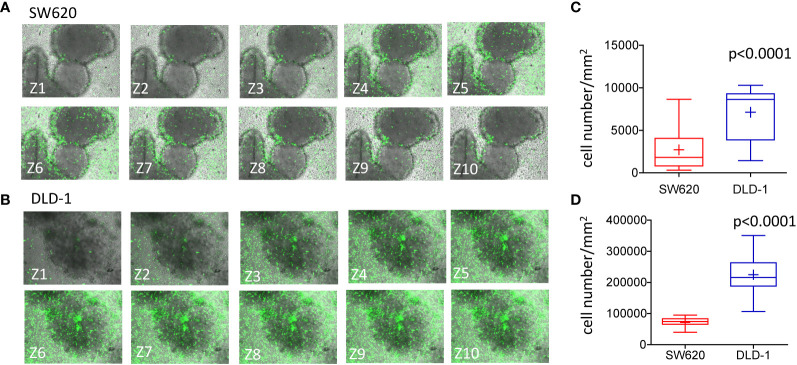
Figure 5.
Infiltration of CRC spheroids by NK cells.I. (A, B): SW620 (A) or DLD-1 (B) spheroids were seeded into a Matrigel dome in Cell Imaging plates (Eppendorf) and incubated with CFSE-labeled NK cells (E:T ratio of 1:1) for 24h. Samples were run under the FV500 confocal microscope and analyzed with FluoView 4.3b software (Olympus). Images were taken at different Z planes (Z1-Z10) every 10μm with a 20x objective NA 0.40 and shown as green CFSE+ NK cells merged with bright field spheroids. (C, D): NK cells present in each Z plane were counted with the Multipoint Analyze Particle tool of the Image J software and plotted as the number of NK cells/mm2 infiltrating SW620 (red boxes and whiskers) or DLD-1 (blue boxes and whiskers) and the mean±SD of 10 Z plans of a single spheroid (C) or mean±SD of NK cells/mm2 infiltrating 20 spheroids evaluated each at 10 different Z positions (D).

