Figure 6.
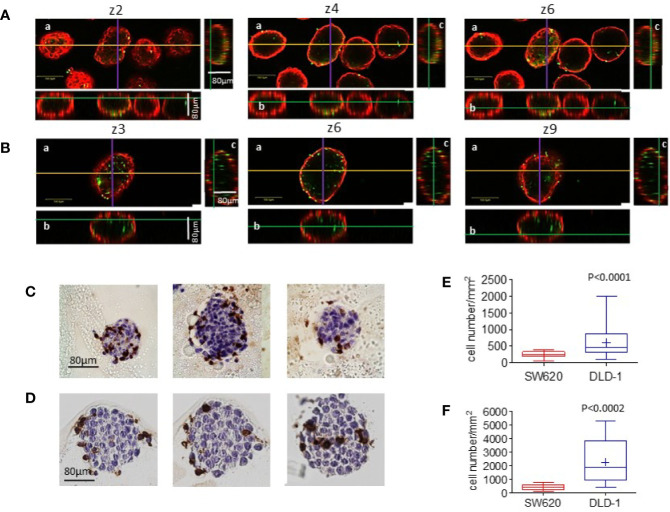
Infiltration of CRC spheroids by NK cells II. (A-B): SW620 (A) or DLD-1 (B) spheroids were seeded as in Figure 5 , incubated with CFSE-labeled NK cells (green, E:T ratio of 1:1) for 24h, washed and counterstained with the anti-ESA mAb TROP-1, followed by Alexafluor647-GAM (red). Samples were run under the FV500 confocal microscope and analyzed with FluoView 4.3b software (Olympus). Images were taken at different Z planes (Z1-Z10) with a 20x objective NA 0.40: three representative z stack sections are shown. Orthogonal cross-section (indicated as yellow line for x axis, purple for y axis and green for z axis) were reconstructed from z-stack scans (80 µm total thickness). For each panel: a) an example of x-y focal plane of the z reported in the subpanel a; b) side view of the z-stack (orthogonal x-z plane) for subpanel a); c) view in the orthogonal y-z plane for subpanel a. Bar in subpanels a: 100µm. (C, D): Other samples of SW620 (C) or DLD-1 (D) spheroids incubated with NK cells were fixed, suspended in melted agarose and paraffin embedded. Four µm thick serial sections were cut (3 sections every 15 µm) and stained with the anti-CD45 LCA mAb, visualized with DAB chromogen (brown) and a hematoxylin counterstain. Digital images were acquired using the Aperio ScanScope Slide program of the Aperio AT2 Scanner with a 40X objective. (E, F): The number of infiltrating cells was calculated with the Image J Multipoint Analyze Particle tool on the ROI designed on the inner spheroid perimeter (graph E), defined on the basis of ESA staining showed in A and B, or on the visible spheroid perimeter (graph F) in the IHC stained specimens depicted in C and D. This is the main reason for the different NK cell number counted in E vs F. Six spheroids/cell line were analyzed at 10 different Z positions in (E) or on 10 serial sections in (F) Results are expressed as cell number/mm2. p<0.0001 (E) or p<0.0002 (F) vs SW620.

