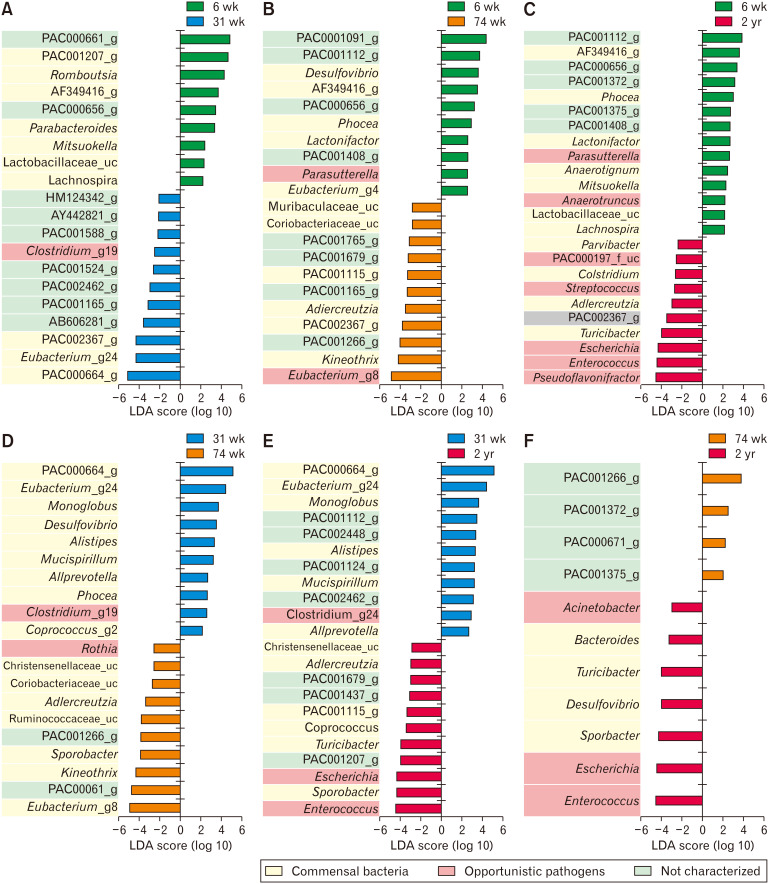
Figure 3.
Linear discriminant analysis effect size (LEfSe) analysis results comparing 2 age groups (A-F). (G) The ratio of commensal to opportunistic pathogens calculated from LEfSe results. The 6- and 31-week-old groups showed a higher ratio steadily than the other age groups. 6 wk, 6-week-old; 31 wk, 31-week-old; 74 wk, 74-week-old; 2 yr, 2-year-old. LDA, linear discriminant analysis; NC, not characterized.


