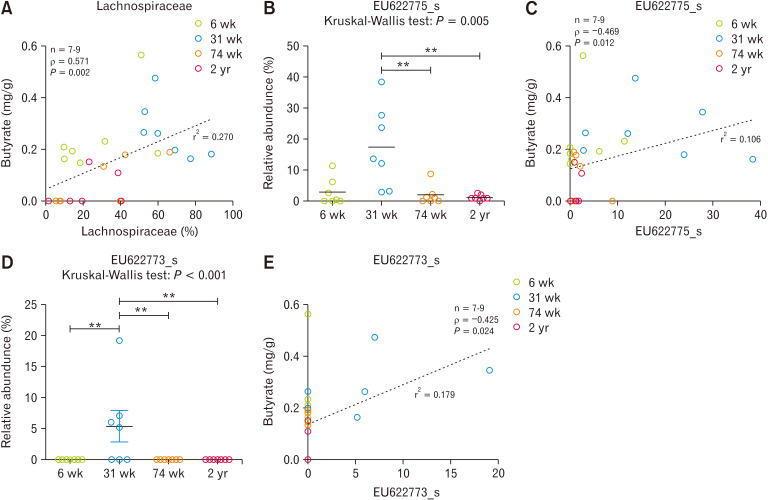
Figure 6.
The correlation analysis between luminal butyrate concentration and compositional change of microbiota in cecum. (A) Lachnospiraceae, (B-C) EU622775_s, and (D-E) EU622773_s. **P < 0.01 from Mann-Whitney U test with Holm-Bonferroni correction as post hoc analysis followed by Kruskal-Wallis test. Dotted line indicates linear regression. 6 wk, 6-week-old; 31 wk, 31-week-old; 74 wk, 74-week-old; 2 yr, 2-year-old.

