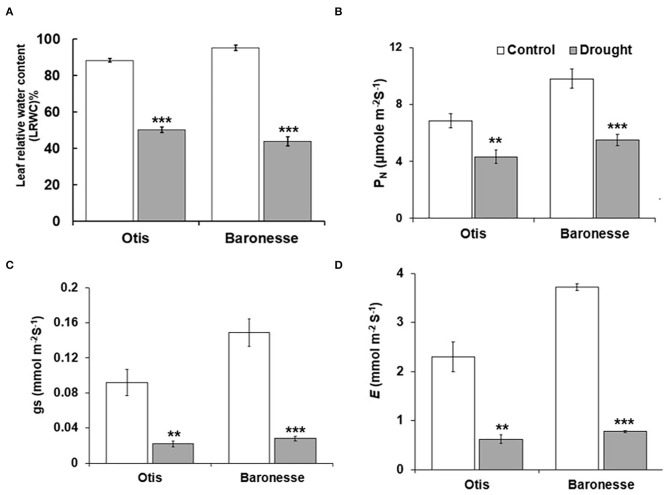
Figure 2.
Physiological changes in Otis and Baroness under drought. (A) LRWC. (B) Net photosynthetic rate (PN). (C) Stomatal conductance (gs). (D) Transpiration rate (E). Values are the means of 10 plants for LRWC and 6 plants for photosynthesis measurements. Bars represent standard errors of the means. **P < 0.01 and ***P < 0.001.

