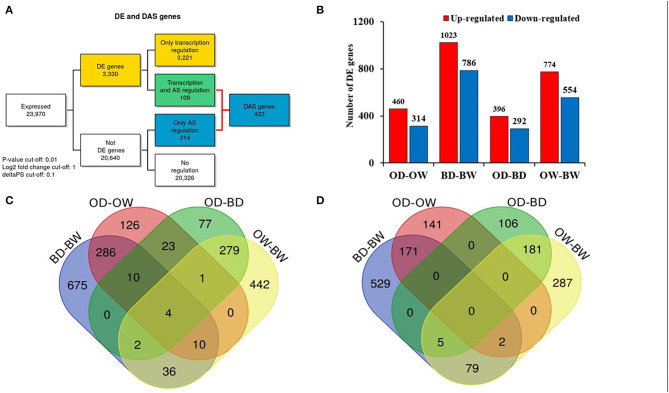
Figure 5.
Differential gene and alternative splicing analysis in two barley genotypes under progressive drought. (A) Number of genes regulated only by transcription (DE), only by alternative splicing (DAS) and by both transcription and alternative splicing (DE+DAS) across barley contrast groups (OD-OW, BD-BW, OW-BW, and BD-OD). (B) Number of up- and down-regulated DE genes in the different contrast groups. (C) Venn diagram of the up-regulated genes of the different contrast groups (OD-OW, BD-BW, OD-BD, and OW-BW). (D) Venn diagram of the down-regulated genes of the different contrast groups (OD-OW, BD-BW, OD-BD, and OW-BW).

