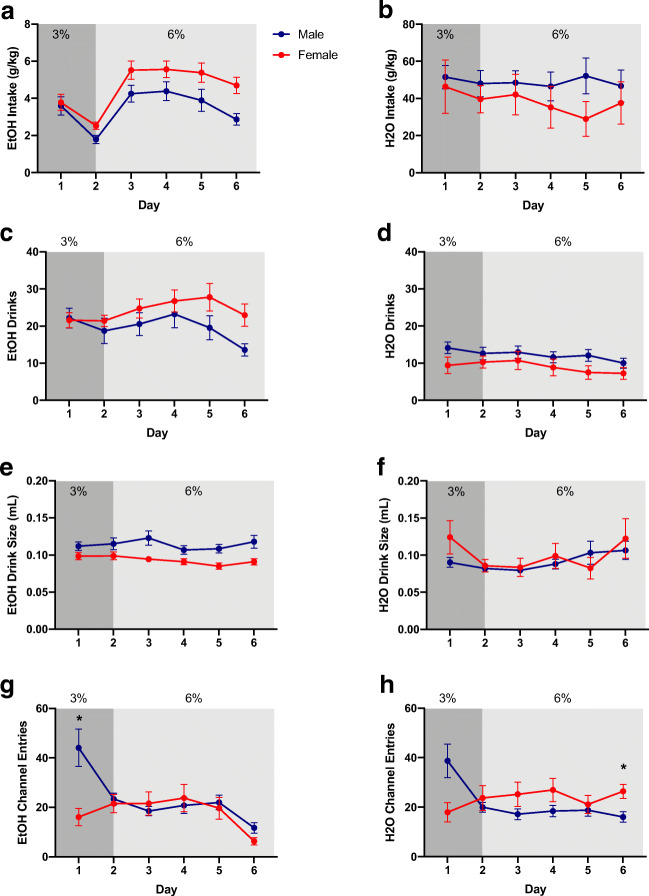
Fig. 2.
Baseline ethanol (EtOH) and water (H2O) consumption, drinks, drink size, and channel entries. Darker shaded regions indicate when the mice had access to 3% EtOH and the lighter shaded regions indicate when the mice had access to 6% EtOH. a EtOH intake (g/kg). b H2O intake (g/kg). c EtOH drinks. d H2O drinks. e EtOH drink size. f H2O drink size. g EtOH channel entries. h H2O channel entries. Data expressed as mean ± SEM. *p < 0.05, compared to opposite sex. n = 24/sex

