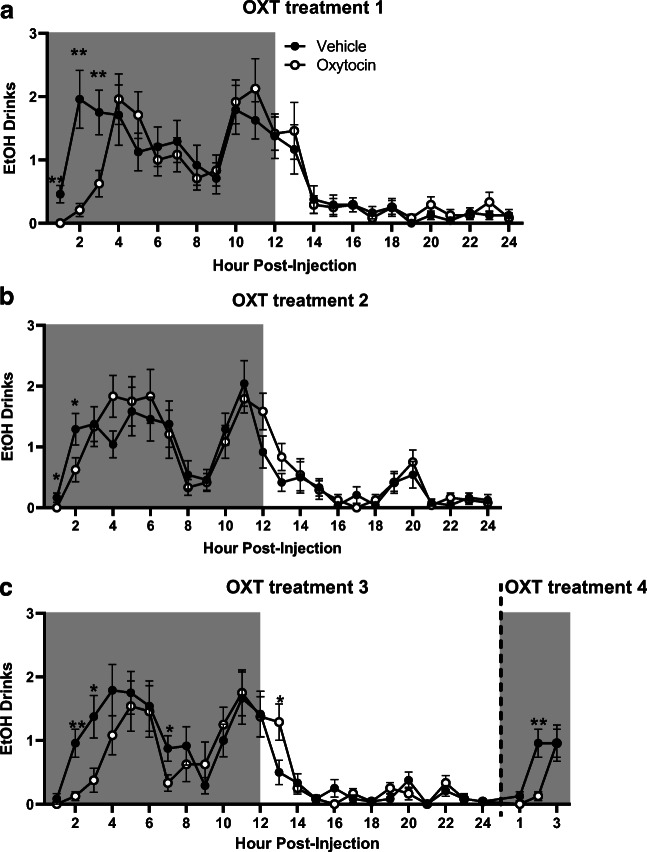
Fig. 6.
Time-dependent effects of oxytocin on ethanol drinks. Shaded regions of the graph are representative of the dark cycle. a Ethanol drinks on the first day of treatment. b Ethanol drinks on the second day of treatment. c Ethanol drinks on the third and fourth day of treatment. Treatment days 3 and 4 where combined for display purposes. Data expressed as mean ± SEM. *p < 0.05, *p < 0.01, compared to vehicle. n = 12/group

