Figure 4.

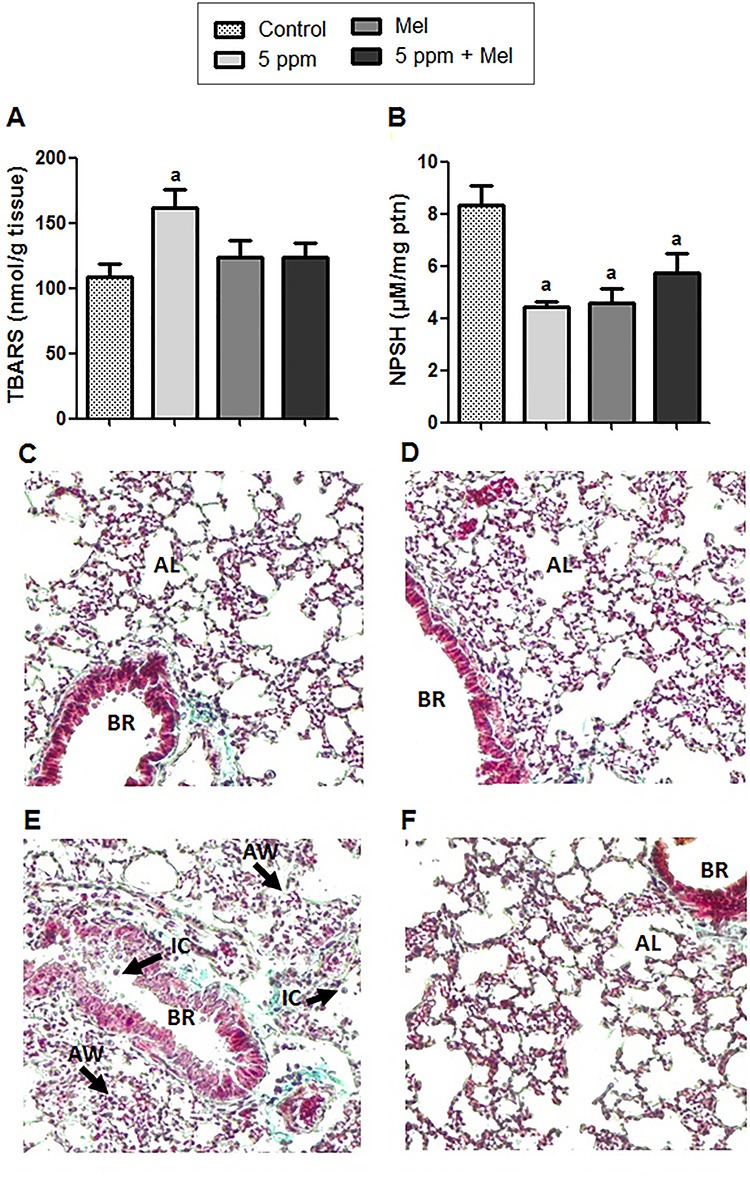
Effect of FA and melatonin in lung tissue. (A) TBARS levels. (B) Levels of non-protein thiols (NPSH). (C–F) Histology of control groups, Mel, 5 ppm and 5 ppm + Mel, respectively; 10x. Data expressed as mean ± SEM. aSignificant difference in comparison to the control group (P < 0.05); BR represents the bronchioles; IC represents inflammatory cells; AW represents the thickening of alveolar wall; AL represents the alveolar lumen.
