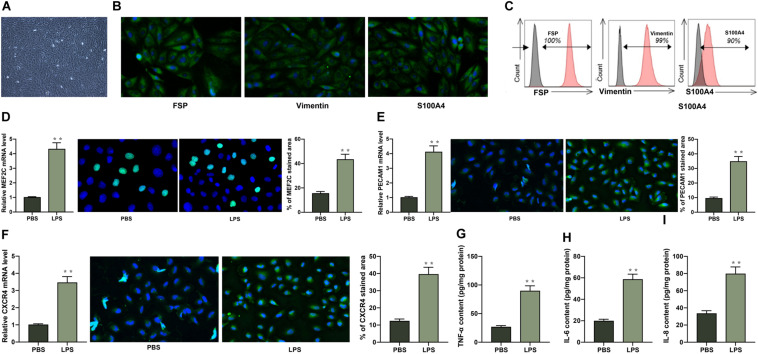
FIGURE 3.
PECAM1 and CXCR4 are highly expressed in LPS-treated HDPFs. (A) Morphology of the HDPFs observed under the microscope. (B) Expression of the HDPF-specific biomarkers determined by immunofluorescence staining. (C) Positive expression of HDPF-specific biomarkers examined by flow cytometry. (D–F) mRNA and protein expression of MEF2C. (D) PECAM1 (E), and CXCR4 (F) in cells examined by RT-qPCR and immunofluorescence staining, respectively. (G–I), secretion of TNF-α, IL-6, IL-8 in cells determined using ELISA kits. Data were collected from three individual experiments and expressed as mean ± SD. Data were analyzed by unpaired t-test. **p < 0.01 vs. PBS.

