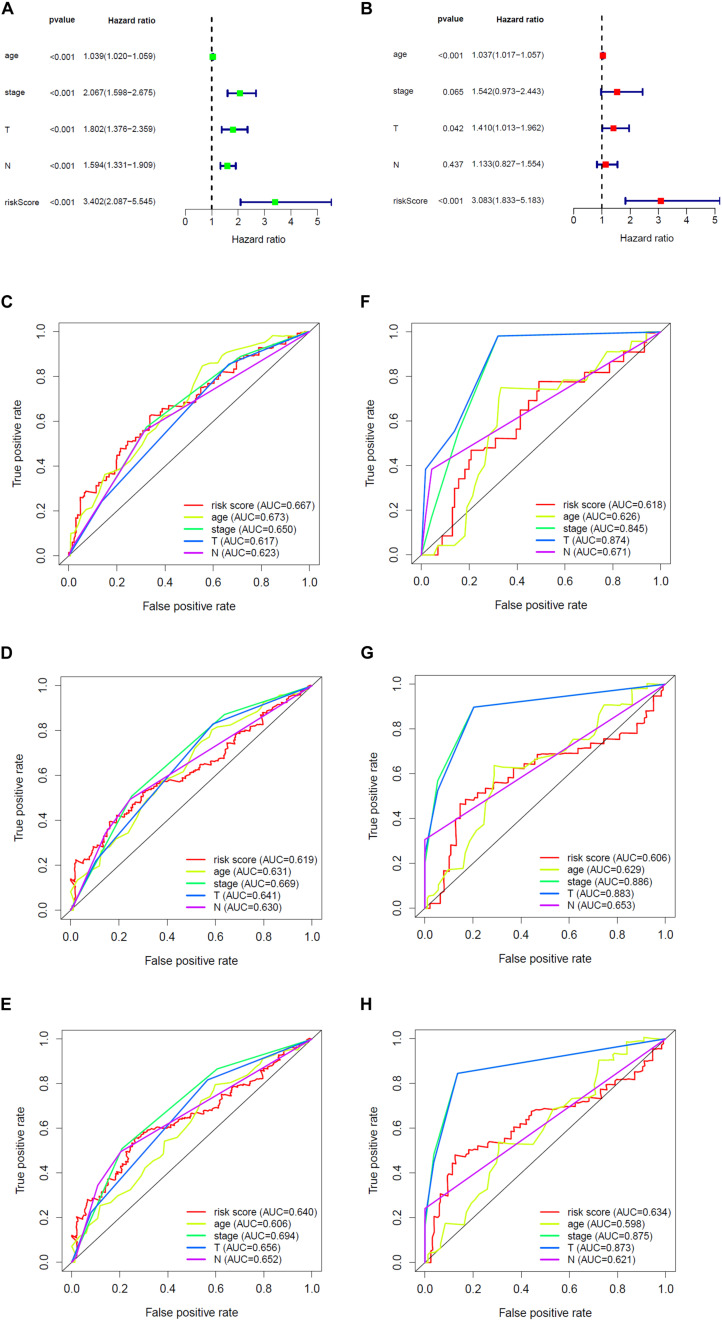
FIGURE 6.
The prognostic effect analysis in the TCGA dataset and ROC curves in the training and validation set. (A) Univariate Cox regression analysis of BLCA in training set. (B) Multivariate Cox regression analysis of BLCA in training set. The ROC analysis of training set for survival prediction by glycolysis-related gene signature at (C) 1-year, (D) 3-year, and (E) 5-year. The ROC analysis of validation set for survival prediction by glycolysis-related gene signature at (F) 1-year, (G) 3-year, and (H) 5-year.

