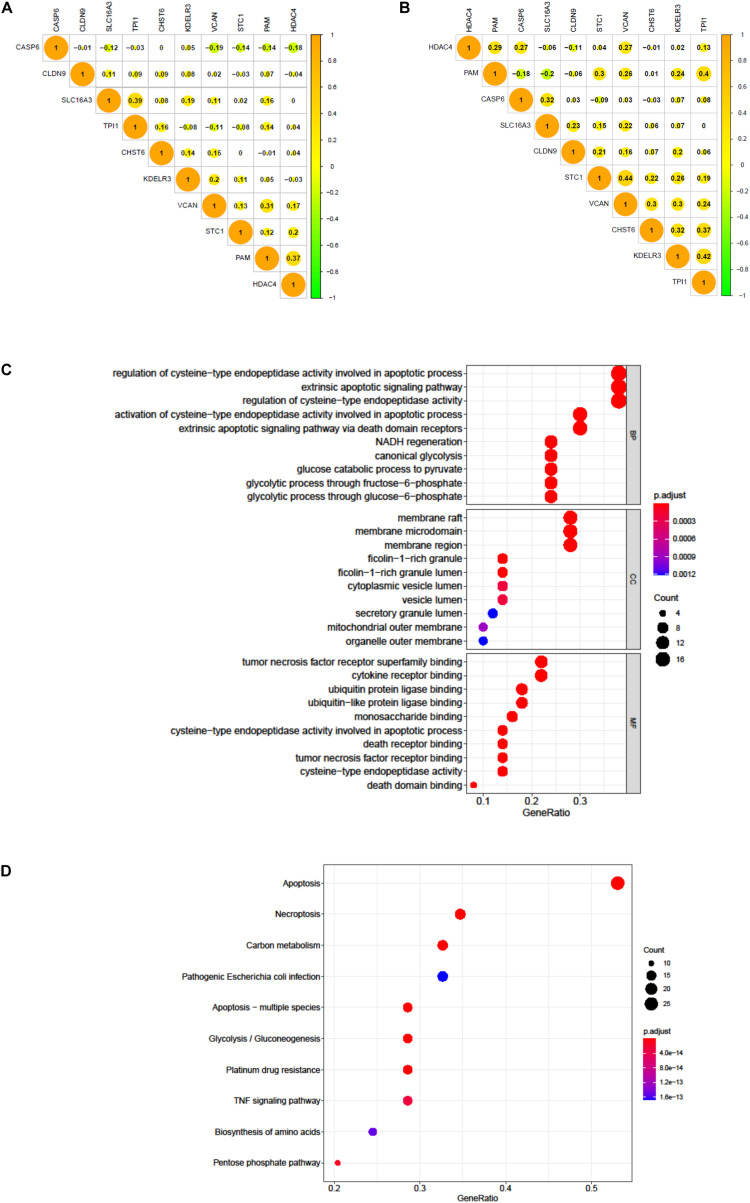
FIGURE 9.
The correlation of 10 genes in BC patients. (A) The correlation of 10 genes in 411 BC patients of TCGA dataset. (B) The correlation of 10 genes in 165 BC patients of GEO dataset. (C) GO analysis of 50 most correlating genes, p < 0.05. (D) KEGG analysis of the 50 most correlating genes, p < 0.05.

