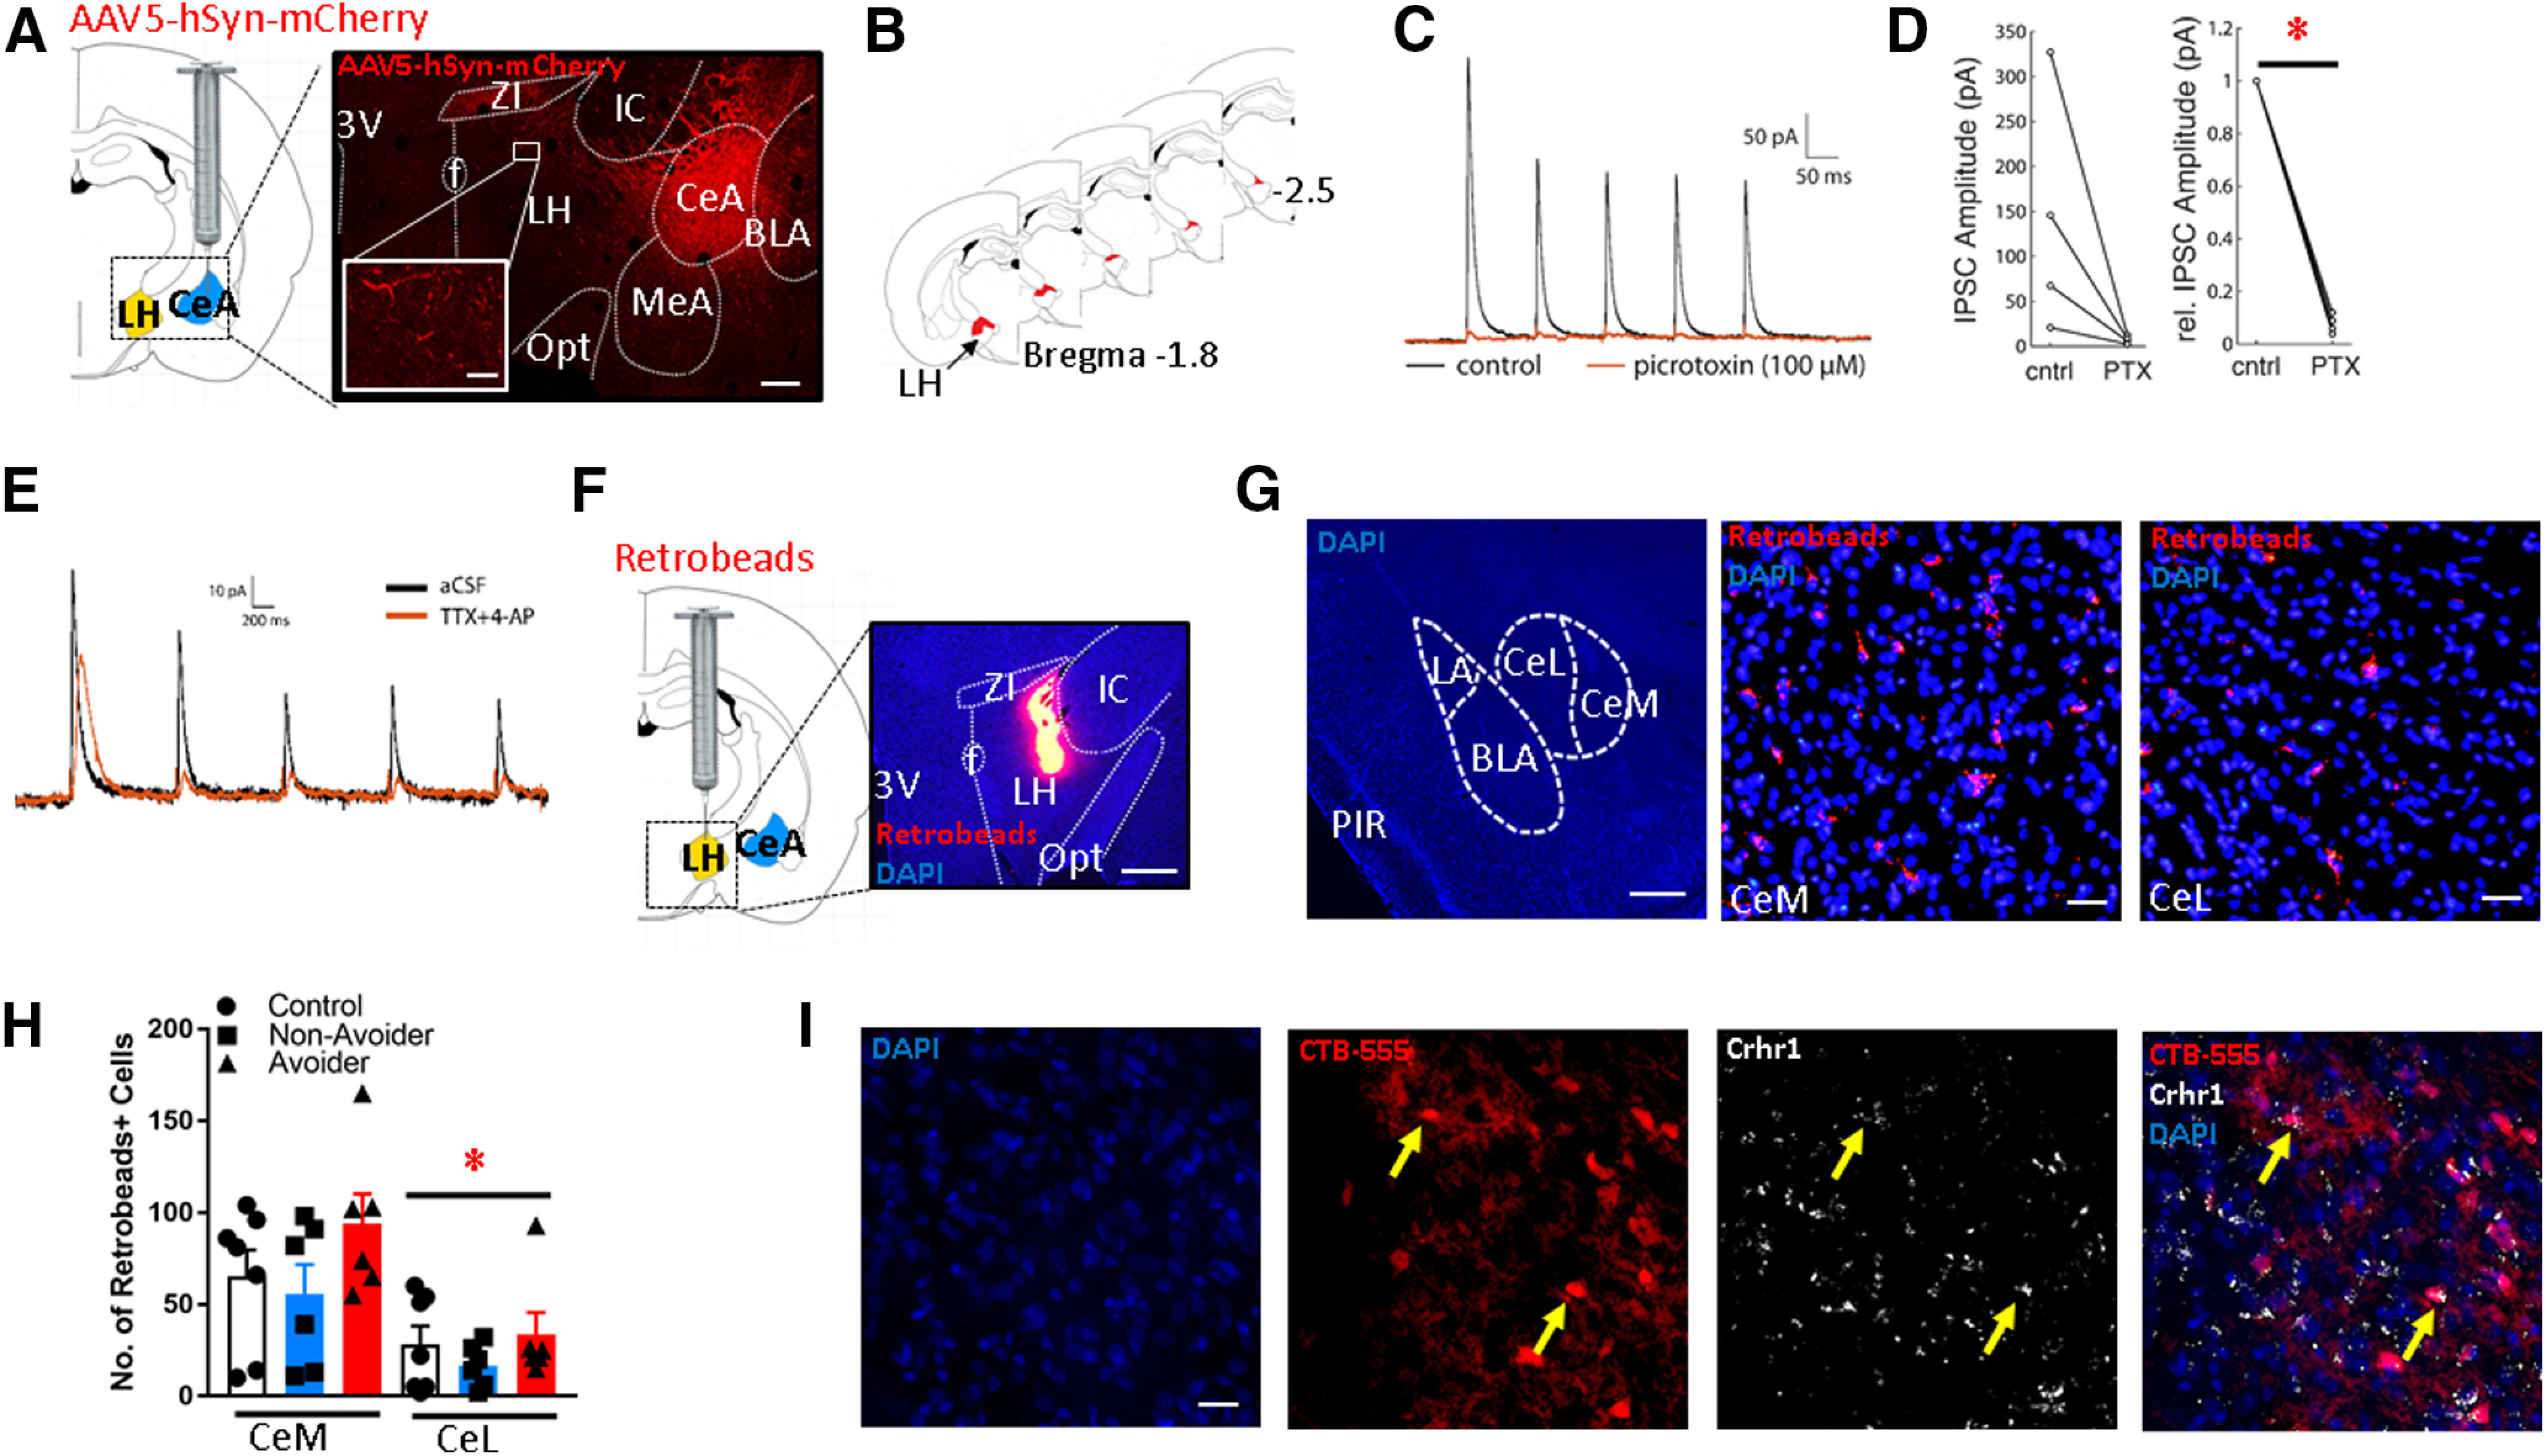
Figure 1.

CeA projections form functional connections with LH neurons. A, Schematic of intra-CeA microinjections of AAV5-hSyn-mCherry. Right, Image showing mCherry expression in a coronal brain section containing the CeA and LH (scale bar: 500 µm). Inset, High-magnification image of mCherry fibers in LH (scale bar: 20 µm). 3V: third ventricle, f: fornix, ZI: zona incerta, LH: lateral hypothalamus, Opt: optic tract, IC: internal capsule, MeA: medial amygdala, CeA: central amygdala, BLA: basolateral amygdala. B, Schematic showing approximate location of mCherry+ terminals (red) in LH along the rostro-caudal axis. C, Representative trace showing optically evoked current of LH neuron in the absence (black) and presence (orange) of the GABA-A receptor blocker PTX. D, In neurons that received PTX, relative synaptic response amplitudes were significantly decreased (*p < 0.001). E, An example recording of postsynaptic current in an LH neuron showing response to optical stimulation of CeA neuron axon terminals before and after bath application of TTX and 4AP. F, Schematic of intra-LH microinjections of Retrobeads. Right, Representative image of intra-LH Retrobeads microinjection site (scale bar: 200 µm). G, left, Low-magnification (2×) image showing medial (CeM) and lateral (CeL) subdivisions of CeA and surrounding landmarks. LA: lateral amygdala, BLA: basolateral amygdala, PIR: piriform cortex. Middle and right, Representative images of Retrobeads+ cells in CeM versus CeL (scale bar: 50 µm). H, Retrobeads+ cell counts in CeM versus CeL of Avoider, Non-Avoider, and Controls rats (*p < 0.001; n = 6 or 7 rats per group). I, Expression of Crhr1 in CeA-LH projection cells (labeled with CTB-555; scale bar: 50 µm). Arrows indicate examples of double-labeled cells.
