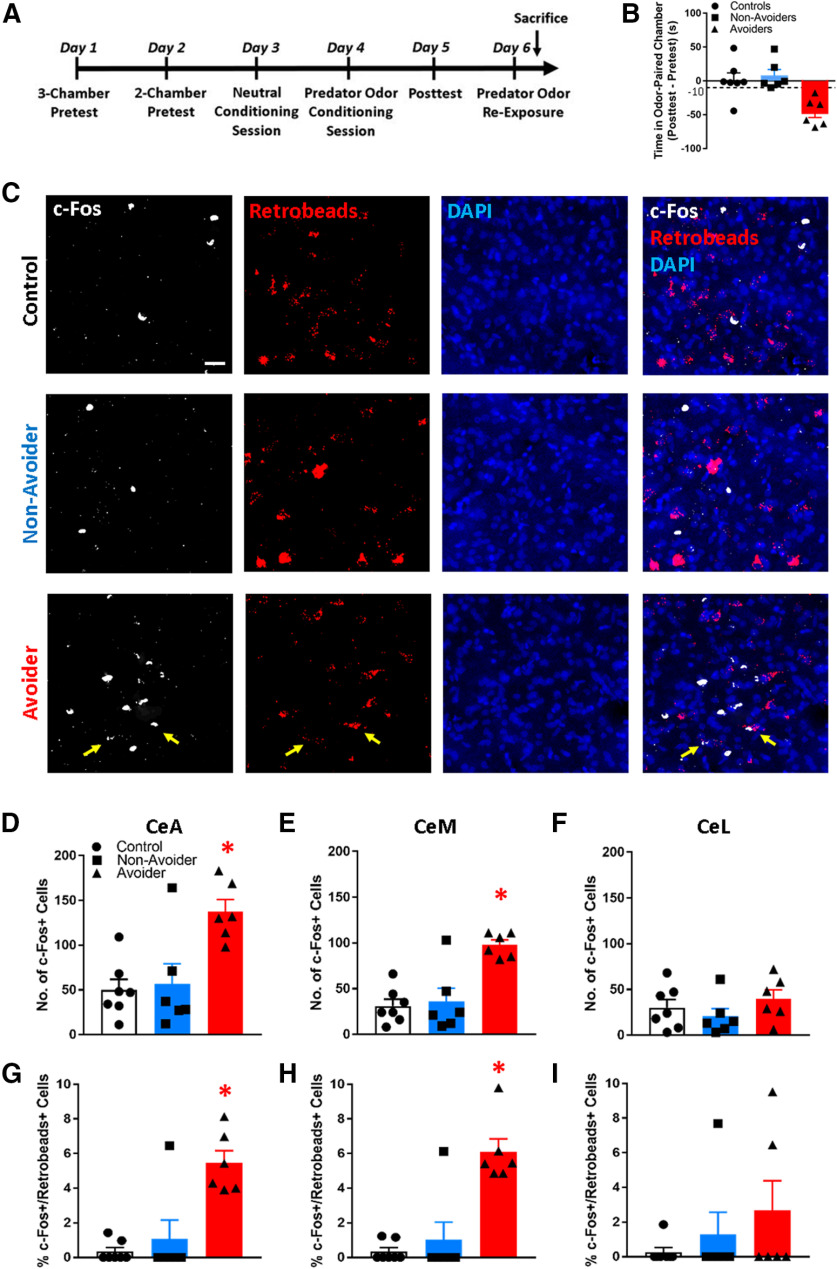
Figure 2.
Avoiders have more c-Fos+ CeA-LH cells. A, Timeline schematic of experiment 2. B, Predator odor stress produces conditioned avoidance in a subset of rats. C, Representative images of c-Fos+ (white) and Retrobeads+ (red) cells in the CeA of Controls, Non-Avoiders, and Avoiders (scale bar: 20 µm). Total number of c-Fos+ cells in CeA (D), CeM (E), and CeL (F) of Avoiders (red), Non-Avoiders (blue), and Controls (black). Percent of c-Fos+/Retrobeads+ cells over total Retrobeads+ cells in CeA (G), CeM (H), and CeL (I) of Avoiders, Non-Avoiders, and Controls; *p < 0.05 (see text for exact p value), n = 6 or 7 rats per group.

