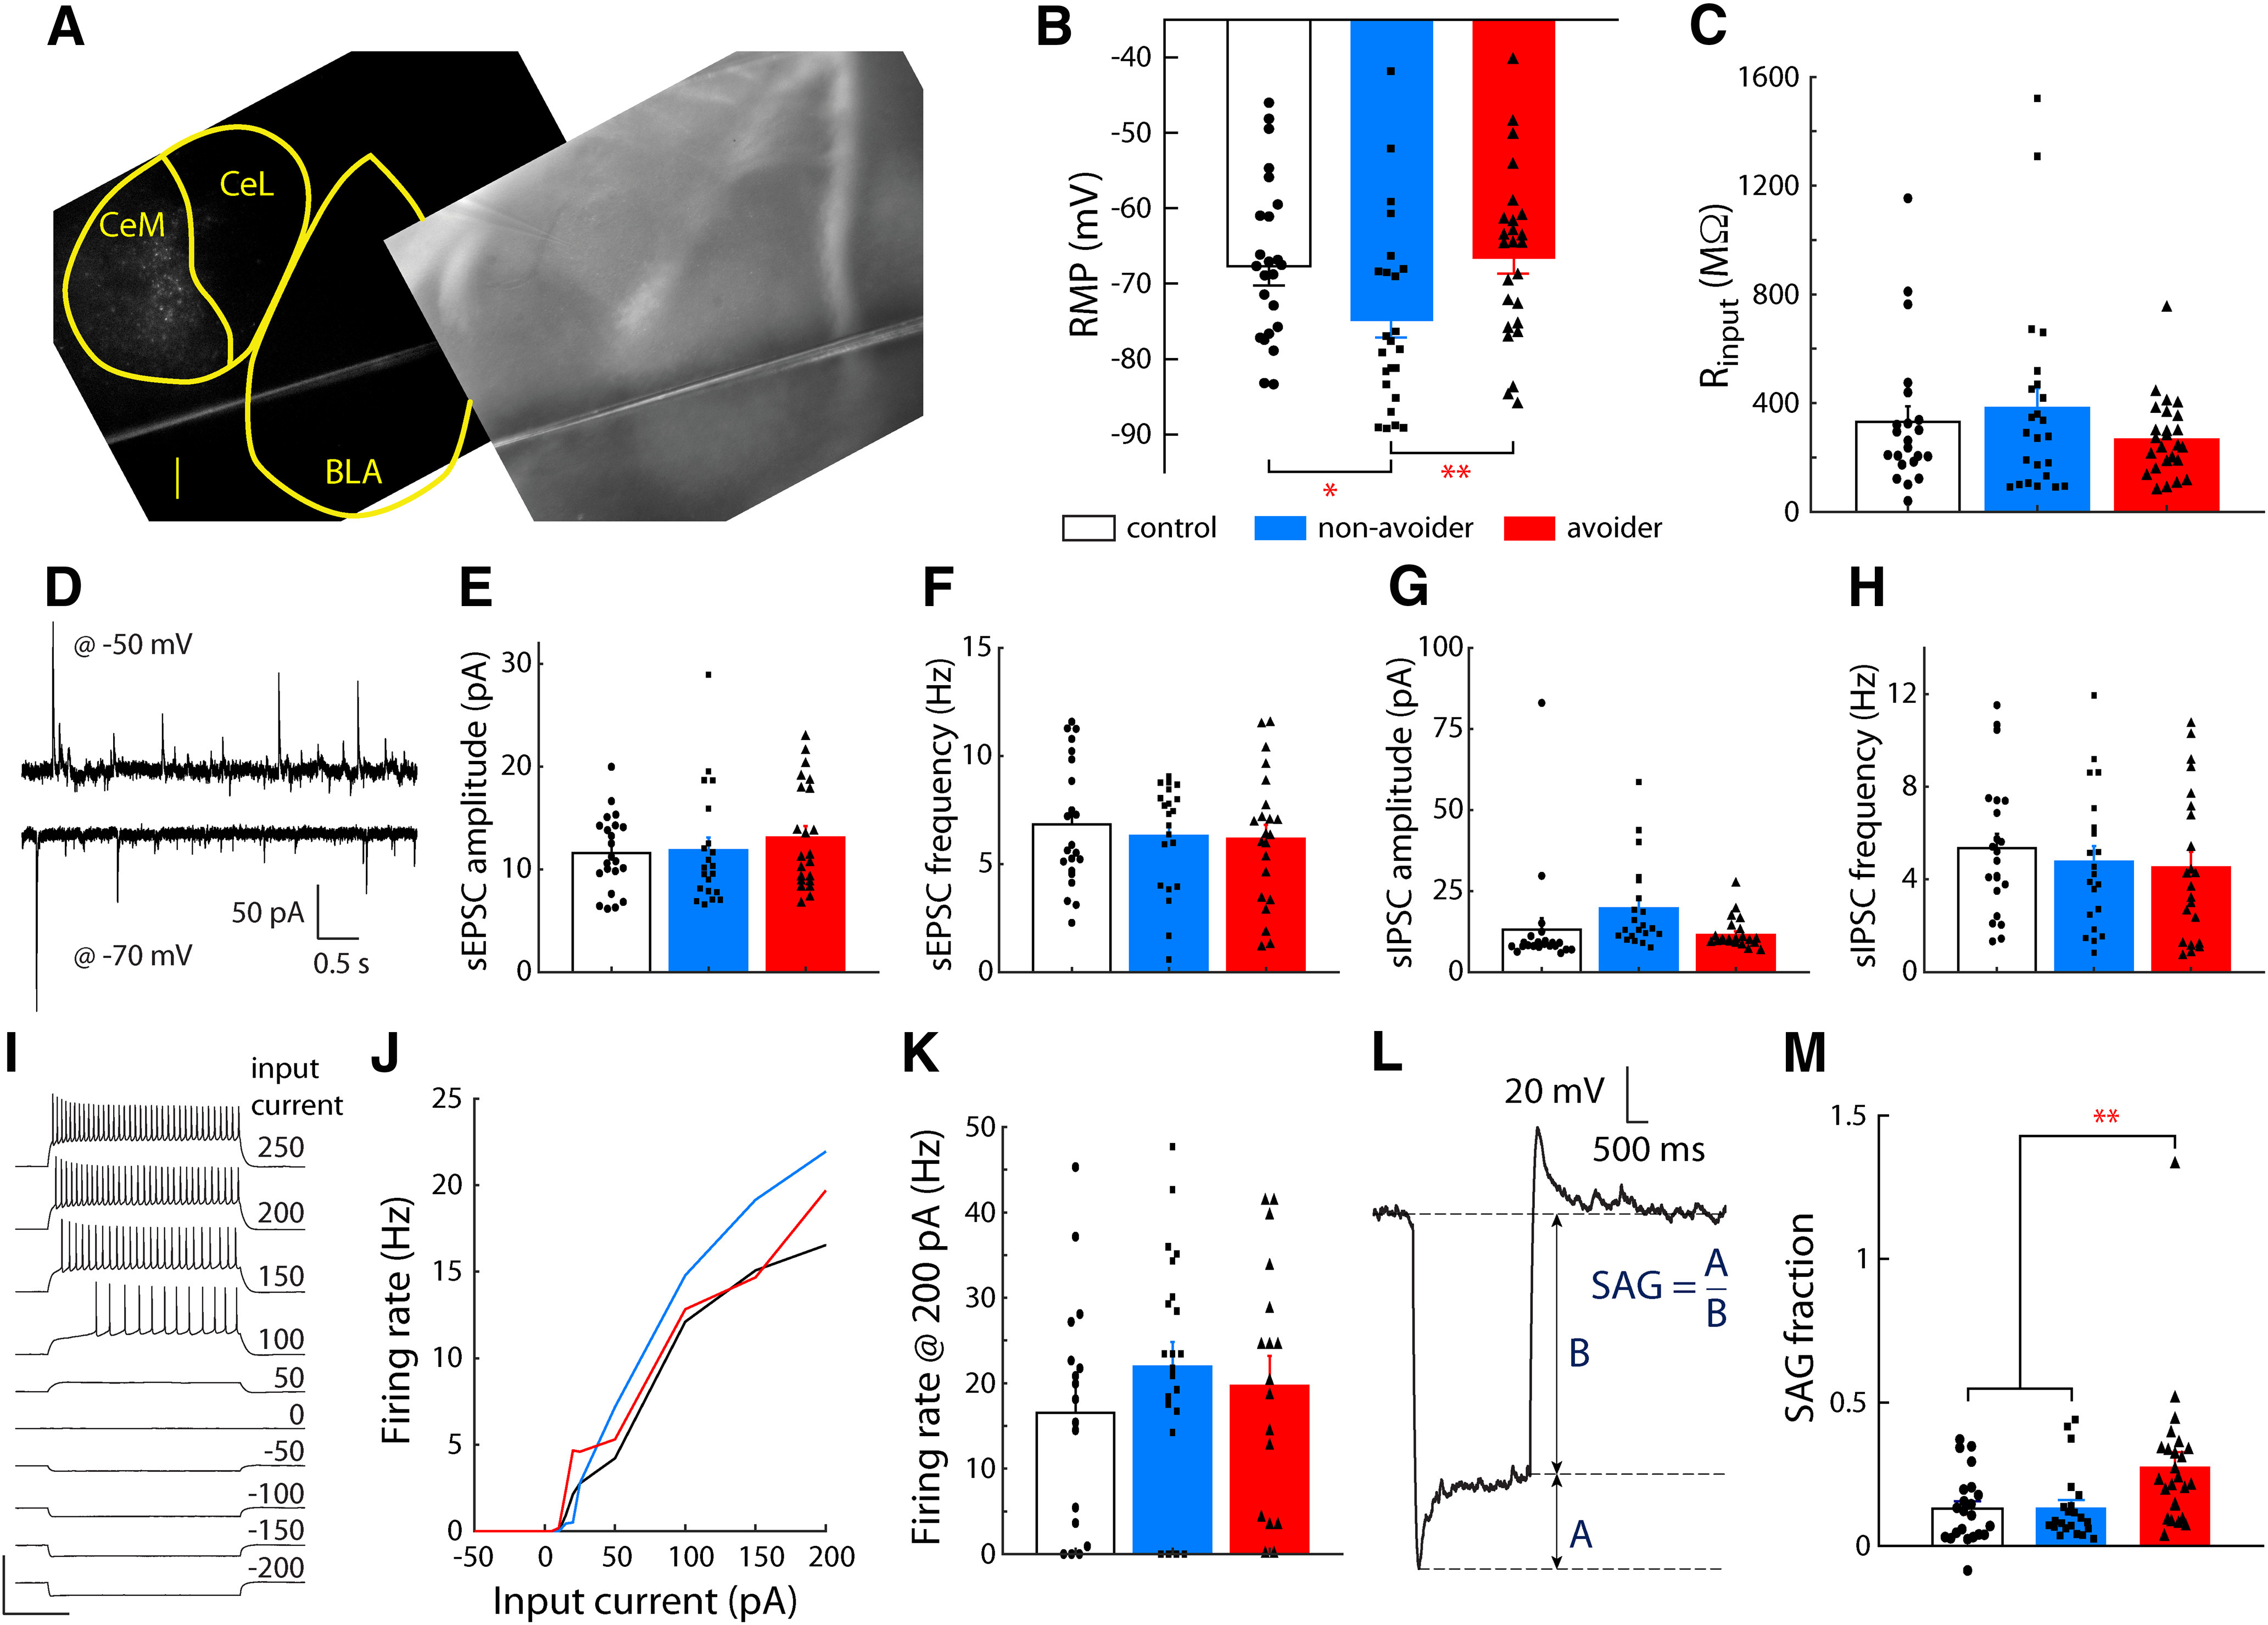
Figure 4.

CeA-LH cells in Avoiders have altered intrinsic properties after stress. A, Representative image showing spatial distribution of fluorescent Retrobeads-labeled cells in CeA (scale bar: 200 µm). RMP (B) and input resistance (C) of CeA-LH cells in Avoiders, Non-Avoiders, and Controls. D, Example traces of postsynaptic currents from a CeA-LH cell recorded with membrane voltage clamped at −70 and −50 mV. sEPSC event amplitude (E) and frequency (F) of CeA-LH cells in Avoiders, Non-Avoiders, and Controls. sIPSC event amplitude (G) and frequency (H) in CeA-LH cells of Avoiders, Non-Avoiders, and Controls. I, A set of membrane voltage responses in step current injections of varying amplitudes in an example CeA cell. Scale bars: 100 mV and 500 ms. J, Input-output current-firing rate function of CeA-LH cells in Avoiders, Non-Avoiders, and Controls constructed using spike counts from current step responses. K, Firing rate in response to 200-pA step current injection. L, An example voltage trace (baseline −70 mV) in response to a hyperpolarizing current. The SAG fraction is characterized as the ratio of: (1) the voltage difference between the minimum hyperpolarization and the new steady state voltage, and (2) the difference between new steady state and baseline resting voltage (−70 mV). These quantities are denoted A and B, respectively, here. M, The SAG voltage fraction of CeA→LH cells from Avoiders, Non-Avoiders, and Controls; *p < 0.05, **p < 0.01; n = 74 cells from 17 rats.
